Archive
Why Applicants Get Rejected by Ph.D. Programs: It’s Fit.
So, it’s the tail end of acceptance and rejection season for applicants to our Ph.D. program. Most years this means I get a couple inquiries along the lines of “why didn’t I get in?” Obviously I can’t answer those directly, but I think it’s worth a post to share my thoughts on the number one reason applications get rejected:
We reject applicants that don’t fit our program.
It’s clear from a lot of the applications we get that many people are not getting advice about how to apply to Ph.D. programs—or at least not getting good advice about it—so I’m putting this out as an aid to anyone who does not have local access to good advice.
Like most places, we evaluate applicants on both quality and fit. To be maximally competitive, you have to be strong on both. If an application fails on fit, quality is largely irrelevant. So what is “fit,” really? It’s not complicated: it’s the extent to which the research you want to do lines up with the research we (the faculty) want our graduate students to be doing. We certainly do reject applications on a quality basis, but we reject more of them because of a perception of poor fit. Finding the right fit and communicating that effectively is a key piece of getting into a Ph.D. program.
We ask for transcripts and a writing sample and test scores (now optional, but recommended) mostly to assess quality. Letters of recommendation are a little of both quality and fit. The primary way applicants can best communicate fit is the statement of purpose. (This has a lot of different names depending on where you’re applying: personal statement, admissions essay, etc.)
To drive home how important the statement of purpose is, let me share a secret: when I read Ph.D. applications, I read this first—and sometimes that’s as far as I get. If you clearly show me that you are a poor fit, it pretty much doesn’t matter what the rest of your application says. If you’re interested in doing research that is not a good fit for my lab, you won’t be able to advance your interests by working in my lab, so this is a bad choice—for both of us.
Many applicants clearly do not understand what the statement of purpose is really for. This is not surprising since it doesn’t actually say on the application itself—we do a bad job on this. (That’s a whole other essay.) So I’m telling you here. We do not want your life story. We don’t care about your passion for cave-diving to preserve the habitat of endangered salamanders (well, maybe we care a little because that’s cool, but it won’t actually help you get in). For those of us reading Ph.D. applications, the primary function of the statement of purpose is to give us an idea of fit. We are trying to select people who want to do the research we are doing. To do that, we need to know what research you are interested in doing. The clearer you can make the connection between what you want to do and what we’re already doing, the better.
Step 1: Find the Right Fit
So, how do you show us that you fit? The first part of that is making sure you actually do fit.
Maximizing your chances of getting into a Ph.D. program actually starts long before the application process. Obviously there’s all kind of useful things to do that happen way before this like taking appropriate classes and doing well in them, getting research experience, etc. but that’s not what I want to talk about here (again, that’s a whole different essay). Here I’m assuming that kind of preparation is already done—I’m talking about actually applying.
The first step in applying for a Ph.D. is figuring out the right places to apply. This requires some very specific homework be done. Figure out the kind of research you want to do for your Ph.D., and then find a program that has faculty who do that thing, or at least something close to it. Applying to a program where none of the faculty do what you want to do is a waste of everyone’s time.
If you do not know what research you want to do, you are not ready to be in a Ph.D. program, full stop. Ph.D. programs are not just more of the same as what you did in undergrad—they are research programs. It doesn’t mean your research interests have to be set for life when you first apply for a Ph.D., but there needs to be a starting point. If you aren’t really interested in doing research at all, you definitely should not be applying for a Ph.D. If you want more education but aren’t interested in research, find a non-thesis terminal Master’s program (we have one of those now!), not a Ph.D. program.
OK, now you know what you want to do, so how can you find out what research the faculty do at a specific program? The good news is that this is generally pretty easy: check out our web sites. Pretty much all of us have one, and we usually describe the research we do there. Failing that, read our recent papers—those will also tell you what kind of work we do. Google Scholar can be a really useful tool here.
However correct that advice is, it’s only helpful assuming you already know where to start. How do you know which programs to look at in the first place? If you’re lucky enough to have a good advisor who knows the area you want to work in, you should talk to that person. They should be able to point you toward programs you should be looking into.
If you’re not that lucky, there’s still a way, but it’s more work. If you’re interested enough in a particular research area that you’re ready to spend the next five-ish years of your life studying it with not much financial compensation, you should have read some recent research papers in that area. (If you have not, you really should do so before you commit to the idea of getting a Ph.D. in the first place.) What labs do those papers come from? Those papers will also cite other papers—what labs do the cited papers come from? That’s where you start. The more specific your research interests are, the smaller the number of places that will be producing relevant research. Find those places, check out specific faculty members, and find some that are doing research that lines up with whatever it is that you want to do.
It’s important to understand that if your application was rejected because of actual poor fit, this was the correct decision for both us and for you. Doing research that doesn’t interest you is a miserable way to spend five years, except that it won’t be five years because if you’re miserable you probably won’t finish. So do yourself a favor and find programs where you get to do the research you want to do.
Step 2: Show Us That Fit
So, now you’ve found some places to apply that fit your research interests, you’ve taken your classes and such and it’s time to actually apply. How do you communicate that good fit in your application? Again, you do it in your statement of purpose.
First, clearly explain what research you want to do. Be as specific as you can—we understand you’re not already an expert (yet) so you may not be able to be super-specific, but do your best. Explaining why that’s the research you want to do is good, too—maybe there’s some real-world problem you’re looking to address, or you care deeply about a particular intellectual question. Put that in there.
Then, you need to explain how that research fits in with what is already being done at the program you’re applying to. To really impress, you need to show that you understand both the field to which you are applying in general and the specific research done by the faculty who are actually in that program. For example, saying “Professor Y does X and I’m really interested in this specific aspect of X” is terrific—but only if Y actually does X and you understand what X is.
If you really are a good fit this shouldn’t be difficult. If you find yourself being challenged by this, maybe you need to reconsider whether you should be applying to that program in the first place.
The worst thing you can do is indicate that you’re actively a bad fit. Some concrete examples of not getting it right, all of which I’ve read multiple times, follow:
- “I’ve always admired Rice so I really want to go there” but they have no research interests that align with any of our faculty. Maybe they want to do clinical psychology or school psychology or something like that, which nobody in the department does. While it’s great that you like our university, that’s not what drives our admissions decisions.
- “I’m really interested in neuroscience and I want to work with Professor Byrne.” I don’t actually do research in neuroscience. How will working in a lab that does not do neuroscience help advance your interest in neuroscience?
- “I want to work with Professors Y and Z” when Y and Z are actually in another program in the department. If you want to work with Y and Z, why didn’t you apply to the program they work in? Yes, we collaborate across programs, but if your primary interests line up with faculty in a different program, you should be applying to that program.
- Similarly, saying something in the right general field but absent from our program also doesn’t work. “I want to work on social aspects of computing” is a non-starter because none of our faculty do research on social aspects of computing.
All of these mistakes are easily avoidable; you should know that because of the homework you did in Step 1.
If your statement of purpose says any of those kings of things, it sends two messages: (1) you don’t fit, and (2) you haven’t done your homework. You are probably not going to get admitted, because there are likely to be other applicants who fit better and have communicated that, and we will take them over you.
Honestly, statements like “I’m really interested in human-computer interaction and human factors” aren’t much help, either. Yes, that’s the name of our program. We assume that if you applied to it, you’re interested in the field, so you really aren’t providing meaningful information by saying this. This is not as bad as an active mis-fit, but it’s not going to help your application, either. HCI/HF has dozens of sub-areas. Tell us specifically what part of the field you’re interested in and which faculty member does the things you want to do.
When we reject students who do not actually fit that’s a win-win. When we reject students who would have fit but didn’t communicate that fit, that’s a lose-lose. I wrote this essay mostly because I want to avoid those situations—please tell us how you fit in so we (and you) don’t lose out!
TL;DR
Applicants get rejected from Ph.D. programs for poor fit, real or perceived. There are two steps to fixing this:
First, find places where they do the research you want to do.
Second, use your statement of purpose to explain to the faculty in those programs how your interests match theirs.
The formula s simple in concept but has to be executed properly, which takes work. Do the work.
Notes
Note 1: To really get this right, you will have to write a new statement of purpose for each place you apply. It won’t have to be entirely novel, but your statement should be tailored to the research interests of the faculty in the specific program you’re applying to. Since the faculty aren’t the same in each place, that means a different statement for each program. It’s work, but if you really want to maximize your chances, you should do that work.
Note 2: I’m in a Psychological Sciences department but I’m pretty sure this advice applies to Ph.D. programs in other sciences and engineering. We work on essentially an apprenticeship model and so are looking for people who want to learn how to do what we do. I get the sense from some colleagues in the humanities that things work a little differently there, so this may not apply. YMMV, etc.
Note 3: This is for Ph.D. applicants, not Master’s applicants. Our Master’s program is a professional program, not a research program, so alignment with specific research interests isn’t as important. Fit to the program as a whole is more what we want to see from Master’s applicants. Remember, we are an applied science program, not a design program.
My Workflow Enablers
Every few years, I write up what hardware/software I use. I’m kind of a junkie for this kind of thing, and people ask me this question periodically, and I haven’t updated in a while and things have definitely changed. Here’s what I’m using these days. I spend probably eight hours a day in front of a computer or a mobile device, so I’m pretty invested and this is a long list, broken in to multiple categories.
macOS: Hardware
Despite all previous ranting, still using Apple hardware. Desktop is an iMac Pro and laptop is a recent MacBook Pro with the useless and stupid touch bar and 4 USB-C ports but nothing else. Peripherals and tweaks that seem worthwhile:
• My keyboard of choice is still the CODE keyboard. Yep, still using this. Great action, love the Cherry MX Clear switches. However, the key caps are wearing off, which is kind of a bummer.
• As my pointing device, I use Apple Magic Trackpad 2. Unfortunately, this is probably the best piece of hardware Apple makes.
• Also still using Griffin PowerMate for media stuff (volume control, play/pause), but they don’t make these anymore.
• At both work and home, I have an OWC Thunderbolt 3 dock, though I have an older model than the one they sell now. Since machines no longer have reasonable port selections, I have one of these at work and one at home. Optical audio out is the reason I chose this brand. They’re a little flaky, though, and sometimes the Mac can’t seem to see them and anything attached to them. Annoying.
macOS: Productivity
There are some real changes here since the last time around, but certain things here will probably never change.
• BBEdit. Seriously, forever. BBEdit is past its 25th anniversary, and I’ve been using it that long. Best text editor ever. Use it all the time for all kinds of things. Coding? Of course. Writing? Sure, sometimes. Taking raw text data and cleaning it up for later data analysis? Absolutely. It’s amazing.
• OmniOutliner. I think in hierarchies, which means outlines. Been on this one for a very long time as well (though not 25 years) and it’d be an absolute nightmare to get rid of this. I have probably a thousand outlines on my machine.
• For papers and other written documents, I use Apple Pages. Word is still awful. Pages is at least OK. For collaborating with colleagues, though, if they’re engineers or computer science people, now ending up often in Overleaf (which really means BBEdit and upload), and if they’re not, well, I spend more time in Google Docs than I’d like.
• For presentations it’s Apple Keynote. I do a lot of presentations (for class), so this gets pretty heavy use. PowerPoint is also still awful, and Keynote is actually good.
• Spreadsheets? Yeah, I switch back and forth between Microsoft Excel and Apple Numbers. Both suck in different ways. As far as I can tell, there’s no good answer here. I probably use Excel more, though, because Numbers does two things particularly badly: you can only sort full rows (it treats each row as a unitary record), and exporting to text is awful.
• For my mail client I just use Apple Mail. Every once in a while I think about trying something else but it just seems like too much work. Also, if you use Mail, you should check out the super-useful msgFiler and SpamSieve.
• For my calendar, I use BusyCal. I used to use Apple’s Calendar, and for several years used Fanstastical. But BusyCal does one thing right that both these other fail on, which is how event editing works. In Calendar and Fantastical, when you click on an event and want to edit it, you get a stupid popup. Ugh. BusyCal does this right and just gives you a properties pane in the same window. I know this sounds like a small thing, but it matters.
• For my to-do list, since version 3 came out I finally actually use OmniFocus. I never really got into this before version 3 because of all the GTD cruft, but now it more or less works for me. But I also use Apple Reminders a lot, too. I’m in a weird space with this, using both, but it’s more or less working for me.
• For simple notes and stuff, for many years I used Yojimbo, and it’s still on my machine, and I’ve used things like Evernote and SpringPad but Apple Notes is now good enough to pretty much replace all these.
• Finally, I use DEVONThink Pro to archive all my old email and to keep things like web clippings and my database of research papers. This is probably overkill and I’m sure I don’t use this software to its full potential but it does what I need for these tasks, so there it is.
macOS: Networking
I hear this internet thing might catch on. Some key tools for me:
• For VPN service, I use TunnelBear. Apparently not the fastest, though I’ve never had problems, but the only one that does a third-party audit.
• My password manager is 1Password. Not especially happy with it since version 7 and the subscription model, but seems like too much work to go find something else. It’s still good, it’s just not quite as good.
• I hate the Twitter web site and the default clients for Twitter, and find I get a good Twitter experience with Tweetbot. I just see things from the people I follow in simple chronological order with no ads. What a concept!
• You can tell I’m a dinosaur by the fat that I still read RSS feeds. For this task on the Mac, it’s ReadKit. Used to use NetNewsWire but when that kind of died I switched and have no plans to go back, since NNW doesn’t support Feedly.
• When browsing the web, lots of web sites screw up the user interface in subtle and annoying ways. StopTheMadness fixes most of these, and is totally worth it.
macOS: Graphics
I am not a major graphics guy, but when I do need to deal with them, here are my tools of choice:
• GraphicConverter. I’m Photoshop-illiterate. I use this for almost all my bitmapped graphic needs and I’ve been using it since the 1990s, though every once in a while I’ll use Acorn for something.
• Mostly what I need to make for work a diagrams, and for that it’s OmniGraffle. By now you may have noticed a trend: I really like the software from OmniGroup.
• For making graphs, it’s DeltaGraph. Long in the tooth and feels like it, but I’ve been using it so long it would take a tremendous amount of work to switch to anything else, so here we are. I think the writing is on the wall here, though, since they still don’t have a Catalina-compatible version. Losing this will be really painful.
• Sometimes I need a screen shot or short recording, and for that I use Capto. I like it because it keeps all the old shots in a photos-like library.
macOS: Development
Yep, I write code. I actually like writing code and wish I had more time to do it. A non-trivial amount of the code I write is simply to automate things on my computer—computers ought to be better for that than they are—but some of it is more traditional code.
• Clozure Common Lisp. Yep, I still write Lisp, and this is the Lisp implementation I use. People used to bitch that Lisp is slow, but modern Lisp compilers are actually fast. Lisp is tons faster than Python, for instance.
• I also write R, and for that I kind of alternate between just using BBEdit and using RStudio. RStudio is nice but the editor isn’t all that great, particularly when compared with BBEdit.
• I also do a little work in Python, but for that I do pretty much everything in BBEdit.
• Keyboard Maestro is a key piece of the automation approach. It’s excellent.
• For a lot of other automation, I use AppleScript. The best things for AppleScript are FastScripts to keep all the important scripts handy and Script Debugger for writing and debugging scripts.
• I generally dislike Windows, but sometimes I have to test on Windows, so for that I use VirtualBox. It’s not as full-featured as Parallels or VMWare, but the price is right.
macOS: System utilities
These are the things that keep my somewhat complicated system up and running.
• Apple allows a little customization of the trackpad, but to really get this right you need BetterTouchTool.
• Here’s one I get asked from time to time: how do you keep your laptop and your desktop in sync? The more recent answer is to keep things in the cloud (better known as “someone else’s computer”), but I was doing this long before people talked about the cloud. The main utility I use for this is Chronosync.
• If all you really want to do is just clone a whole volume (and make it bootable!), though, the best tool for that is definitely SuperDuper! Great for backups.
• When disks go bad, DiskWarrior is sometimes the only recourse.
• There are a lot of utilities that let you access hidden preferences and do some little bits of system maintenance. I can’t really say if it’s the best one at this point because I haven’t tried them all, but I use Cocktail for this.
• A specific problem: I want to make all the printers attached to my main machine visible on my home WiFi. Solution: Printopia. (Side note: one of the better company names in the indy software world.)
• Apple’s SpotLight search technology is… OK. Sometimes the (free) EasyFind is a better answer.
• The problem with running a lot of utilities is that they take up a lot of menu bar space. On a big display, this is no big deal. On a laptop, however, things get cluttered. I manage this with Bartender.
macOS: Miscellaneous utilities
Little things that make Mac life a little easier.
• All applications should support pasting using the current style, or pasting without retaining the styles of what’s in the clipboard. They don’t. So, there’s PlainClip.
• I hate shopping in stores. Doesn’t everyone? But that means there are a lot of packages to track. I used Deliveries for this. I used to use Parcel, but I wasn’t happy when they went to a subscription model.
• As someone with an undergraduate degree in engineering earned in the early 1990s, I need to have an RPN calculator. PCalc is the one and only, super-venerable answer. Also has the greatest about box of all time.
• I like to know what’s going on with my machine, and my favorite constant system status monitor is iStat Menus. Gotta have those CPU load indicators in the menu bar, which is especially amusing when you have an 8-core machine.
macOS: Audio and video
I’m a bit of a music nerd. My home machine is connected to an audio system that cost me about [REDACTED], so I worry about this kind of thing way more than I should. Here’s what I use to deal with audio files, with a nod to video at the end.
• If your Mac is connected to any kind of external audio device, you need SoundSource. Seriously, just go buy it. Should be built in to the operating system, but it isn’t, so here we are.
• Now, for serious listening sessions, there’s the “take control of your external audio and lock it down” solution which handles things like different sampling rates and bit depths, I use Audirvana. Warning: spendy. Bought in a moment of weakness.
• If you want a nice free utility to convert sounds from one format to another in batch, say to convert FLAC files to ALAC for iTunes, my took of choice is XLD.
• Amadeus Pro is the (spendy) sound editor for high-power editing and sound analysis. Again, I bought this years ago as part of a bundle. Today I probably wouldn’t and would just stick with Fission, or maybe just the Lite version.
• Fission is what I use for most routine sound editing. In particular, if you have a sound file (say, you’re digitizing a bootleg from a cassette) and want to split it into individual songs, this is the tool. The Rogue Amoeba guys are terrific.
• Speaking of Rogue Amoeba tools, I also love Audio Hijack. I use this when capturing audio from… well, from anything, really. Digitizing an old cassette? Hijack. Recording the telecon so you can refer to it later? Hijack. Can’t download from SoundCloud? Just Hijack it!
• TunesArt is a lovely (and kind of frivolous, but who cares?) software to display album cover art.
• If you want the truly esoteric, I’m here for you. I walk the family dog most mornings, and so I want music that keeps me going, but not too fast or not too slow. To do that, audio files have to be tagged with their cadence, or beats per minute (bpm). It’s a pain to do by hand, so… BeatGague.
• Finally, there’s video. I don’t do much in the way of video editing, but I do rip blu-ray discs so that I can put them on the home media server. For this kind of thing, there’s Handbrake (and it’s free!).
iOS: Productivity
I increasingly do work on my iPad ever since the advent of the Apple Pencil. This will probably increase when iPadOS comes out in fall of 2019. For a lot of things, it’s possible to use the same software on iOS and macOS, and that’s exactly what I do with many apps, like OmniOutlier, OmniFocus, Apple Notes, Apple Mail, and Apple Pages. I guess technically I use Keynote and OmniGraffle on my iPad, too, but rarely. But there are a few programs that I use primarily or entirely on iOS.
• With the Pencil, I now take a lot of hand-written notes, like in meetings or when I go to talks. For this, I use Notability, which I really like a lot. (There’s a macOS app version of this which is pretty bad and I use basically read-only). Under very active development and getting better all the time, too. I even use this for lightweight PDF annotation.
• For heavy PDF annotation, like when one of my grad students gives me a draft of a thesis, I use PDFExpert. For years and years I used GoodReader but I finally gave up the ghost when GoodReader went over a year without being updated, then finally came out with an update and the update was just really underwhelming, with pad Pencil support. End of an era. PDFExpert is OK but I don’t love it.
• So, while on macOS I use BusyCal, on my phone I use Fantastical. This is just a great phone calendar. BusyCal has an iOS version but it’s pretty awful. Note that I only use the iPhone version of Fantastical. On the iPad I just use Apple’s Calendar, since Fantastical charges separately for the iPad version (boo) and, as mentioned, BusyCal on iOS isn’t very good.
• For text editing, I used to use Editorial, but that went a couple years without an update, so I gave up. Now I use Drafts.
iOS: Networking
Again, several tools here carry over from macOS: 1Password, Tweetbot, TunnelBear. But some specifics for iOS:
• DarkSky is my favorite weather app. Apple just bought them, though, so not sure what’ll happen going forward.
• Wikipanion is a great (and free) way to access wikipedia, which I find to be a bit clunky on mobile browsers.
• Mapping is a nightmare. Apple Maps has by far the best UI, but the data are garbage (slightly less so with iOS 13 but still not good enough). Google Maps has great data, but I’m sure is selling every search you make, plus the UI is awful. Waze has good traffic data, but also a suspect UI and some other oddities.
iOS: Miscellaneous utilities
A few little things here and there to make life easier on the phone. This includes some macOS things like Deliveries, but there are again some iOS-unique things.
• Once in a while I need to track how long I spend on things, and do so in different categories. For this task, I use aTimeLogger.
• For keeping up with game scores, I use theScore, but this isn’t really an endorsement—it’s entirely possible this is simply worse than other alternatives. I haven’t spent a lot of time looking into this.
iOS: Development
I think the primary weakness of iOS, is that it’s not a great development platform. I would really like to be able to use R and maybe Python on iOS. (There’s Pythonista for iOS but that hadn’t been updated in a long time. It recently was so I’ll be checking that out later this summer.) Even AppleScript would be great, but alas, we don’t even get that. What we do get for some small automation tasks is Apple Shortcuts, which is a start, but even that’s not much.
iOS: Fun
I’m not much of a video game person, but there are a few games on my devices, and a couple other bits to support my hobby, which is playing bass guitar.
• I use Anytune (the Pro version) to play back music at a slower pace while I’m learning a new song.
• Guitar Tuna is great if I’m not attached to my pedalboard, and also usefully has a metronome.
• For playing back podcasts, I use Overcast.
• Ahh, games. Despite that fact that it’s buggy and slow, I still enjoy playing Ascension on my iPad.
• My favorite is probably Civilization Revolution 2. Civ6 is just a bit too much for mobile, IMO.
• Gotta also have Settlers of Catan, right?
• Gotta have a solitaire, right? I go with Solebon Solitaire.
Why My Fantastic New iPhone Annoys Me
I just upgraded from an iPhone 7 to an iPhone XS, and the experience has left me in a state of high annoyance with Apple. No, not because of any problem with the XS. Quite the opposite, actually.
The issue is that the XS is just so much better than the iPhone 7. In only two years Apple has upped the bar so much it ridiculous. It’s a dramatic improvement in almost every way. It’s really an engineering triumph. I mean, check out stuff like this:
The iPhone XS is faster than an iMac Pro on the Speedometer 2.0 JavaScript benchmark. It’s the fastest device I’ve ever tested. Insane 45% jump over the iPhone 8/X chip. How does Apple do it?! ✨ pic.twitter.com/5nCKZUCAYK
— DHH (@dhh) September 21, 2018
But… isn’t that a good thing?
It would be if everything else in Apple’s product line were also going along gangbusters. But it sure looks from the outside like all the engineering talent and energy is directed at the iPhone. Maybe also the Watch, but I hate watches so I don’t pay any attention to that. and maybe a few folks working on the iPad, but that’s pretty much just a big iPhone anyway.
But are there any engineers at Apple actually still working on the Mac?
Let’s take a look at the the progress in the Mac lineup over those same same two years since the iPhone 7 came out (that is, since September 2016).
Mac Mini
Not updated at all in those two years. Not even a minor speed bump, literally nothing whatsoever. Not since… 2014. I have this vision of one guy who’s been moved to the basement, like Milton in Office Space. He’s the lone guy working on the Mac Mini. He has no budget, no timetable… and they’ve even taken away his stapler. Poor guy.
MacBook
One minor update 15 months ago (June 2017) with a small speed bump and increased RAM capacity. Not an increase in the default amount of RAM, though, just an update in what you could order. And Apple always charges such reasonable prices for increased RAM, right? Could have been executed by a trained money, or more likely, a summer intern. (I can say that, I was a summer intern at Apple once upon a time.)
Mac Pro
Hahahahahaha… What a travesty. No, not only not updated in the last two years, but not updated at all since 2013. Well, really 2014 because it was announced in 2013 but didn’t actually ship that year. You remember this announcement, where Phil Schiller smugly declared “Can’t innovate anymore my ass.” And what was the “innovation” here? Non-upgradability? Hey, Phil, how about you worry less about doing something radical and do something flaming useful instead?
The best Mac I’ve ever owned was the last Mac Pro before this one. God, those were great machines. Room for four hard disks, on great modular sleds. Easily accessible RAM. Optical audio in and out. Tons of ports. Slots galore. Built like a tank, and while it could put out some heat, it was still quiet.
And then we got… the wastebasket. At leas it was pretty fast when it first shoed up, which was nice, but that was where it ended. I’ve been using Macs since 1987, and this is one of the worst machines I’ve ever had. Even in the days of OS8 my machine didn’t crash as much as this one did. Eventually they patched the OS enough that this got under control, but by then the hardware was two years old, surely to be soon replaced by… oh yeah, nothing. And nothing until 2019. Wanna bet that it’s not gonna be the first half of 2019?
iMac
Probably the most progress here, just because more than one thing happened. The first was, in June 2017 (sounds familiar) we got… a spec bump across the line! We did get something real in December 2017 (again, not really in 2017 since these didn’t really arrive for most customers until January 2018) with the iMac Pro, which was a concession to the fact that the Mac Pro both sucks and hasn’t been updated in forever, and won’t be for a while yet. I bought one of these and… it’s OK. In all fairness, the specs are very good. It’s fast. It has a reasonable, but not overwhelming, number of ports. The display is indeed fantastic. It is in no way expandable or upgradeable, but that’s what you get with an iMac and why I haven’t bought one before (other than for my lab). It’s also insanely expensive. I guess it has that in common with the iPhone. But, there was some actual engineering effort put in to it, which is more than you can say for the rest of the list before this.
MacBook Air
They still make these? Does anyone buy them? What exactly is the big differentiation between these and just regular MacBooks, again, now that MacBooks have SSDs and weigh 2lbs? Ahh, these have slightly larger screens and are slightly faster than regular MacBooks. Makes perfect sense. Anyway, updates in the last two years… A minor bump in specs in—wait for it—June 2017, and added an SDXC slot. Probably the same summer intern that did the regular MacBook.
MacBook Pro
Ahh, the other “pro” machine, and one might be tempted to think that this is where all of Apple’s Mac engineering resources not devoted to the iMac Pro ended up, because here we have something actually new: the TouchBar!
Except the TouchBar is, to put it lightly, crap. An utter waste of engineering resources. First, it’s basically just eye candy, but has almost zero actual functionality. The only thing I use it for is to change the display brightness, but that’s because they removed the normal keys that handled this function and moved it to the TouchBar, so I have no choice. What else is it good for? I cannot even begin to tell you, in no small part because the actual regular keyboard on the MacBook Pro is an unmitigated disaster. I use an external keyboard with my MacBook at every available opportunity, so most of the time, the TouchBar isn’t even within easy reach. So even if it were great, I’d still basically never use it.
And then there’s the disaster that is the port situation with the current MacBook Pros. 4 Thunderbolt3 ports (more or less USB-C ports) and nothing else. Look, I get that TB3/USB-C is the future and keeps the machine slim, and I love that I can dock the machine to all my peripherals and displays and such with one cable (thanks to the not-inexpensive third-party Thunderbolt 3 dock I had to buy), so I fully approve of having a couple TB3 ports on the machine. TB3 is the future and all that, couldn’t agree more.
But no other ports at all? Really? So when I give a presentation (like, you know, when I teach, which I do several times a week), I need TWO dongles. One for HDMI to connect to the projector because literally zero projectors at my university have USB-C connections (and I bet it’s ten years before that changes), and one USB-A dongle to connect my presentation remote, because nobody makes those yet, either. (I guess I was supposed to buy a Bluetooth one when I bought all those Bluetooth headphones for the iPhone 7. I missed that memo and still have regular USB-A remotes that still work great.) Could you just have given us those two legacy ports, please?
And then there’s MagSafe. MagSafe was one of Apple’s great triumphs. MagSafe put all other power connections to shame. If I had a dollar for every time I saw a laptop (including mine) saved by MagSafe, well, I guess that iMac Pro wouldn’t have been so bad price-wise. MagSafe was a masterpiece. But because USB-C is the future, that had to go, too. I guess Apple profits whenever someone has to replace their laptop because it goes flying off a table. (The good news is that at least someone gets it; Griffin Technology makes something they call a BreakSafe USB-C power cable that’s clearly inspired by MagSafe. $40, of course, but what else are you going to do if Apple abandons a great technology they pioneered?)
The best laptop I’ve ever owned? The 2015 MacBook Pro. Decent keyboard, useful set of ports, solid Retina display, just slower than the current models. I handed mine down to a graduate student and whenever I see him with it, I feel pangs. Almost worth downgrading.
So, yes, Apple has devoted some engineering resources to the Mac in the last two years, but in this case, they spent time and energy to make a machine that’s actually worse—substantially worse—than the one preceding it. (Not quite as bad as the 2013 Mac Pro, but still.)
Scorecard
Two years of iPhone progress shows clear evidence of a large team of talented engineers working furiously. The last two years of the Mac?
No evidence of engineering, 0 points: 4
Some engineering progress, 1 point: 1
Backward engineering progress, -1 points: 1
Net total points: 0
It reminds me of that scene from The Usual Suspects:
Cop: I can put you in Queens on the night of the hijacking.
Hockney: Really? I live in Queens. Did you put that together yourself, Einstein? What, do you got a team of monkeys working around the clock on this?
Really, Apple, it’s great that my new phone runs JavaScript like a bat out of hell, but frankly I’d really rather have new Minis, a decent laptop, and a new Mac Pro—one that is actually a “pro” machine. I can live with JavaScript being the speed it was on the iPhone 8, honest. Move some engineering resources around, would you please?
Final Thoughts
Apple has always charged a premium for hardware, but in my judgment it’s always been worth it. In part because of macOS but also because it has generally been solid hardware. (I managed to avoid buying a Performa back in the day, so I dodged one of the previous bullets.)
The problem is that I’m locked in to macOS. Windows is a pile of hot garbage and, as a result of being a Mac guy for now thirty years, I have a lot of material in Mac-only formats. Back in the late 1990s I considered dumping Apple for Linux because of software; OS8 was pretty awful. Now I’m considering dumping Apple for Linux because of hardware, but I’m reluctant because of software. Oh, the irony.
The part of this I really don’t get is how it could ever actually get this bad. Don’t Apple’s own engineers use Macs? How have they not heard a roar internally for better hardware? How do the folks at Apple who work on the A12 not go crazy? Do they use Linux boxes inside Apple these days? I have a hard time believing iOS is being developed on something other than macOS. Or are people unhappy but just not being heard? Hey, we’re a trillion-dollar company, who needs good hardware to do engineering work? It simply makes no sense.
This may be a screed, but it’s not a screed from some Apple-hater. If anything, I’m a long-time Apple loyalist. And if even I’m disaffected, that cannot be a good sign for Apple.
Many moons ago, I used to work in Greg Joswiak’s group, and from that I know Greg is a reasonable guy. (Greg is now Apple’s VP of marketing. Someone who ought to have Tim Cook’s ear.) So, Greg, how have you not thrown your MBP through the wall when typing on it? Surely you have to connect to something other than USB-C when you give presentations when traveling—got all your dongles handy? Anyone sent your machine flying for lack of MagSafe? No?
So, yes, I really like my new phone. I’m super-impressed by it. I just wish I could generate the same enthusiasm—heck, just any enthusiasm—for Mac hardware these days. But I can’t. And that’s a problem.
Reactions to the iPhone7 Announcement
A couple people have asked me what I think of the iPhone 7. I upgrade every other year, and this is my year, so I’ll be getting one.
I’m going to take Apple’s 10 points in roughly reverse order of how much I have to say about each one of them.
Apple Pay in Japan
Look, I love Apple Pay. I’m sure this is a big deal for Apple, but since I neither live in or travel to Japan, I don’t really care.
Jet Black and Matte Black Finishes
Uhh, cool, I guess? The real question is whether the jet black is just a vehicle for making fingerprints and scratches look prominent and awful. I’m going to risk it.
Water Resistant
About.
Freakin’.
Time.
Seriously. Thank you. Not that I get my phone wet a lot, but it’ll be nice to not worry about this.
Stereo Speakers
I’m going to have a lot to say about audio later, but this feature, while nice, isn’t really a big deal. I rarely listen to music directly out of my phone. Now, maybe I would more often if the speakers were better, so maybe this will make a difference, but I’m not expecting much. They’ll still be tiny little crappy speakers.
New Display
Brighter and with a wider color gamut. I’ve seen one of the iPad Pros that has this wider gamut and it is, indeed, beautiful. However, I’m not sure that it will really matter all that much in my normal daily use. I’m a terrible photographer (more on that in a moment) and it’s just not my primary concern, though I’m glad Apple worries about it so much. I am, however, interested in it being brighter, which hopefully means that it’ll be easier to see in bright sunlight. Any help there is actually useful, so I’m looking forward to that bit.
New CPU/GPU
The most relevant part of this is indirect, which is battery life. It’s always nice that it’s faster, but we’ve now reached the point where I have a two-year-old iPhone 6 and for the first time I’m not chomping at the bit for a new phone because my current one feels slow. Nope, it’s actually pretty much fine most of the time. So, while being way faster is cool and all (woohoo, 400 flying monkeys… except that I almost never play compute-intensive games), it’s less important to me than it has been before. Plus, you know, it’s kind of expected. They get faster every year. I mean, really, do you expect Phil Schiller ever to get up on stage and go, “oh, yeah, same CPU as last year.”
New Camera
As noted above, I’m not a particularly good photographer. And much like the new CPU, there is always a newer, better camera every year. And don’t get me wrong, I like that there’s a newer, better camera every year. It makes my crappy snapshots look a little less crappy. I am particularly pleased with this year’s improvements, though, as image stabilization will probably make a real difference for me (I get a lot of slightly blurry pics, so I guess I tend to jiggle the camera when I go to press the button), and better low-light capabilities are always welcome, as apparently I see better than most cameras do because I end up with a lot of dark pictures in circumstances when I feel like I can see just fine. So this is welcome but not really earth-shaking for me, as it’s just snapshots anyway.
New Home Button
So, up to this point, most of the new features have not been major (other than water resistance), but have all been at least not worse. I won’t know for sure about this one until I get a chance to play with it, but I’m worried that this could actually be worse. The presentation was suspiciously light on details and early reports from press folks who got to play with have been… well, mixed. Including one that basically said it was horrific. There’s something to be said for physical buttons. I mean, I get why not to have a physical keyboard—I was behind that one from the beginning—but if you are going to have a single* hard, dedicated button, seems like it wouldn’t be bad for it to be a real button, not just a sensor with a motor underneath it. We’ll see.
* This is actually kind of a bone I have with the iOS design, the single button. While Android certainly has its share of foibles (in particular, can a phone I buy this year run next year’s OS? Probably not? Hmm…), a universal “back” button strikes me as a really good idea, and I wish iPhones had this.
No Headphone Jack, and Airpods
These are both part of the same thing, and this is certainly one of the things that has gotten a lot of attention. And this one is a big one for me, too. See, I’m a bit of a headphone guy. As in, I own probably a dozen pairs of headphones (including $350 ones and multiple $200+ pairs), several sets of earbuds, dedicated headphone amplifiers, that kind of thing. I semi-regularly read a web forum (head-fi.org) devoted pretty much exclusively to headphone gear. I’m kind of invested in things that have a traditional headphone jack, and while most of my gear isn’t mobile stuff that I’d actually plug into a phone anyway, some of it is, including my beloved Audio-Technica ATH-MSR7s and ATH-ANC9s.
(Warning: Skip this paragraph if you already know what a DAC is and why it matters.) A little sidebar on what it means, from a technical standpoint, to not have a headphone jack. What the iPhone outputs over the lightning connection is not an analog audio waveform, it’s just bits—you know, 1s and 0s. The Apple 30-pin connectors that were on older iPhones actually did output analog audio, but the lighting port doesn’t. So, to get an analog signal out, you need two things: a DAC and an amplifier. The DAC (stands for “Digital to Analog Converter”) turns the bits into an analog waveform, and the amplifier amplifies that waveform so it’s loud enough to be audible. The iPhone has always had a DAC in it, and still does (it has to in order to get sound out of the on-board speakers). There are quality differences in DACs (high-end audio DACs retail for thousands of dollars), and the DAC in previous iPhone models was actually a pretty decent one for something as small as a phone. (The amplifier was nothing special, though.)
The upshot of all that is now you need a DAC and amp to listen to music out of your iPhone. While Apple has historically used pretty good DACs (given size constraints), I have my suspicions about how good the DAC/amp combo is in Apple’s included $9 adapter, mostly because it’s really small and really cheap. Plus, ugh, yet another adapter/dongle. I wonder how many of these I’ll lose, or be without when I need one. And let’s be clear, I’m probably mostly going to be using the dongle. One of the problems here is that while I generally like Apple stuff, their EarPods suck. No way I’m using Apple EarPods over my beloved Sennheiser MX760s (unfortunately discontinued) or even my Yuin PK2s.
So the other offered solution is Bluetooth. Unfortunately, Bluetooth technology also sucks. Every year it keeps sucking, and every year the Bluetooth consortium says “wait until next year—it’ll be great then” and every year it still isn’t. I’m even willing to believe that Apple has actually solved this problem with their custom W1 chip, but until someone else licenses those, it’s still not going to result in a great solution, because everything Apple is likely to put those into is also probably going to suck. I understand that Apple now owns a headphone company, Beats, and Beats has access to the the W1 chip. Unfortunately Beats is not an acceptable option in my book—Beats also sucks. Well, that’s a little unfair. Some Beats products are actually tolerable, but not at the price points they hit. As I said to John Gruber on Twitter, Beats doesn’t sell $300 headphones, they sell $100 headphones for which they charge $300. Seriously, go listen to a Beats Pro (retail $400 but easily findable for $300) and then compare it to the $100 offerings from companies like Sennheiser, Audio-Technica, or AKG. And that’s pretty much the top of the Beats line. Not exactly compelling.
Thus, for the time being, the most likely decent solution (from an audio quality standpoint) is an outboard DAC/amp like the Oppo HA-2 or the TEAC HA-P50. Not exactly something I will be able to carry with me all the time, and not particularly cheap. I’ll probably end up lugging one of these around when I’m bothering to lug around the MSR7s, but that’s only some of the time.
Now, maybe Bluetooth solutions that are along the line of the Bragi “The Headphone” will eventually be good, and Apple dumping the headphone jack will almost certainly spur a lot of development on this problem. I’m sure the universe of options will be much improved in a year or two. But I bet they won’t ever be as cheap as even good earbuds like the Yuin PK2 (under $50 if you can find them on sale) and definitely not the dirt-cheap but still decent Sennheiser MX385.
So, maybe this will be good for Apple because they end up selling a lot of AirPods and lots of wireless Beats (probably at a pretty good margin). But I have a hard time seeing how this will be good for me, particularly in the short term. I do understand that Apple says they could not have gotten the new camera and better battery life if they had kept the headphone jack (good article about this here) but it’s still a pretty steep cost. I mean, I don’t think it’s worth the apoplectic fury of the more virulent Apple-haters, but it’s certainly a substantial minus.
Redux
My wife and I each upgrade our phones every two years, and one of the kids gets our orphaned phone. That means right now my younger son’s phone is 4 years old and it’s dying. While I’m actually pretty happy with my current 6, he really needs a new phone. So no matter what I think, I’m upgrading anyway. (In fact, I already put in the order. Got up just after 2am on order day to put in my order for a 128 jet black regular 7, then went back to sleep.)
Were it more of a choice, I’m not sure I’d upgrade this year. While I’m thrilled to see it be waterproof (water resistant, whatever) and pleased to get a better screen, faster processors, and a better camera, I’m not so sure about the home button and I’m definitely in the camp of people who is put off by the lack of a traditional headphone jack. I knew it had to come eventually, I just wish the wireless offerings were better and cheaper.
Translating SPSS to R: Mixed Repeated-Measures ANOVA
As usual, it’s been far too long since I’ve posted, but the fall semester is coming and I’ve been ramping back up on both SPSS and R lately and I’d like to get in a couple more posts to finish off this series. Thus, the return.
This post will cover a simple mixed repeated-measures ANOVA. That is, an ANOVA with both within-subjects and between-subjects factors. I’ll continue to use the Elashoff data set that I used in the last post; the data are in the file elashoff.xls. The data file is just as described in that last post, with 11 variables: subject number, the group number (the between-subjects variables) an then 9 measurements that make up the 3 x 3 within-subjects part of the design.
In the within-subjects part of the design, there were main effects of drug type and dosage, but no interactions. Adding the between-subjects effect actually generates an interaction, which looks like this:

Basic Mixed ANOVA
Basic ANOVA in SPSS
Again, SPSS makes the easy things easy, and the code to get SPSS to do this is straightforward:
GLM T1D1 to T3D3 BY Group

/WSFACTOR Type 3 Dose 3

/PRINT ETASQ.
This is the same as the entirely within-subjects code, but with the addition of “BY Group” which tells SPSS to include a between-subjects variable. Simple, no?
SPSS produces the same printout that shows the pairings between the individual variables and the levels in the repeated-measures design so I won’t repeat that here. In addition, since there is now a between-subjects effect, it provides a listing of the number of subjects in each between-subjects group, like this:

The next thing it produces is the sphericity output, which is now different because of the between-subjects factor. That looks like this:

And here’s our first really, really serious problem. If you have a between-subjects factor, SPSS’s computation of the Hunh-Feldt epsilon is WRONG. Yep, it’s just plain incorrect. SPSS has known about this bug for decades, but hasn’t fixed it yet. Hard to believe, but true. It’s not way off, but it’s a little bit off. R gets it right, below, so look there to see the correct number. How they get away with this year after year, version after version, is simply beyond me.
Next is the big ANOVA table with all the within-subjects factors. It’s big and ugly, but it’s all there:

Same basic effects for all the purely within-subjects parts, but now we pick up the interaction of “group” and drug type, which was evident in the graph.
Also notice that this time I requested effect size estimates. SPSS only gives partial eta squared, which is probably the worst of them all, but it’s (very slightly) better than nothing. Finally, SPSS provides the tests of between-subjects effects, which in this case isn’t very interesting, but it is necessary for completeness. Here’s that result:

And there you go. SPSS produces a lot of other output, including multivariate tests and all kinds of default contrasts, but that’s not new here.
Basic ANOVA in R, Wide Format
This is, in fact, also a fairly simple modification of the strictly within-subjects code from last time as well. There are two main differences. First, of course, is that R has to be told explicitly that something is a factor. Second, R needs to have a default set so that it computes sums of squares properly for the mixed design. That’s the “options” statement in the code right after the “car” library is loaded.
The code looks like this (assuming as usual that the data are attached so variables are local):
## Create labelled factors for w-s factors

Type = factor(c("T1", "T1", "T1", "T2", "T2", "T2", "T3", "T3", "T3"))

Dose = factor(c("D1", "D2", "D3", "D1", "D2", "D3", "D1", "D2", "D3"))
## shorter, but equivalent, way to do this
Type = factor(c(rep("T1", 3), rep("T2", 3), rep("T3",3)))
Dose = factor(rep(c("D1", "D2", "D3"), 3))
## load "car" library and set options
library(car)
options(contrasts = c("contr.sum","contr.poly"))
## Add the between-subects factor
GroupF = factor(Group, labels=c("No Sleep", "1hr Sleep"))
## run the ANOVA and print a summary
Anv3 = lm(cbind(T1D1, T1D2, T1D3, T2D1, T2D2, T2D3, T3D1, T3D2, T3D3)~GroupF)
Anv4 = Anova(Anv3, idata=data.frame(Type, Dose), idesign=~Type*Dose, type=3)
summary(Anv4, multivariate=F)
And again, even for this relatively simple three-way design, there’s a fair amount of output:
Univariate Type III Repeated-Measures ANOVA Assuming Sphericity

                    SS num Df Error SS den Df         F    Pr(>F)
(Intercept)      79900      1   630.11     14 1775.2523 3.774e-16 ***
GroupF             187      1   630.11     14    4.1499 0.0610036 .
Type               426      2   599.64     28    9.9444 0.0005457 ***
GroupF:Type        410      2   599.64     28    9.5669 0.0006816 ***
Dose               878      2   549.89     28   22.3635 1.572e-06 ***
GroupF:Dose        102      2   549.89     28    2.6068 0.0915784 .
Type:Dose           46      4   554.11     56    1.1556 0.3402490
GroupF:Type:Dose    27      4   554.11     56    0.6776 0.6103418
---
Signif. codes:  0 ‘***’ 0.001 ‘**’ 0.01 ‘*’ 0.05 ‘.’ 0.1 ‘ ’ 1


Mauchly Tests for Sphericity

                 Test statistic  p-value
Type                    0.25246 0.000130
GroupF:Type             0.25246 0.000130
Dose                    0.75866 0.166077
GroupF:Dose             0.75866 0.166077
Type:Dose               0.17106 0.009729
GroupF:Type:Dose        0.17106 0.009729


Greenhouse-Geisser and Huynh-Feldt Corrections
 for Departure from Sphericity

                  GG eps Pr(>F[GG])
Type             0.57223   0.004847 **
GroupF:Type      0.57223   0.005548 **
Dose             0.80558  1.232e-05 ***
GroupF:Dose      0.80558   0.105049
Type:Dose        0.52518   0.330823
GroupF:Type:Dose 0.52518   0.522531
---
Signif. codes:  0 ‘***’ 0.001 ‘**’ 0.01 ‘*’ 0.05 ‘.’ 0.1 ‘ ’ 1

                    HF eps   Pr(>F[HF])
Type             0.5898996 4.424443e-03
GroupF:Type      0.5898996 5.082647e-03
Dose             0.8946538 4.788591e-06
GroupF:Dose      0.8946538 9.867570e-02
Type:Dose        0.6200127 3.347825e-01
GroupF:Type:Dose 0.6200127 5.448314e-01
And yes, these are the correct HF epsilons. What SPSS is doing here I don’t know. So, other than that, you get the same thing out of R that you get out of SPSS, if in a somewhat less appealing format and with more complex code.
Basic ANOVA in R, Long Format
Again, this requires conversion of the wide-format data into long format. This is accomplished with the same code as in the entirely within-subjects example, and simply requires the addition of the options set and coding of “group” into a factor as well. It looks like this:
## melt into long form

library(reshape2)

stim.lng = melt(stim, id=c("Snum", "Group"), variable.name = "Cond", value.name="Alrtns")
## code separate factors for Type and Dose
stim.lng$TypeF = factor(substr(stim.lng$Cond, 1, 2))
stim.lng$DoseF = factor(substr(stim.lng$Cond, 3, 4))
## Make Snum into a factor
stim.lng$Snum = factor(stim.lng$Snum)
## make Group into a factor
stim.lng$GroupF = factor(stim.lng$Group, labels=c(“No Sleep”, “1hr Sleep”))
## load library and set options
library(ez)
options(contrasts = c(“contr.sum”,”contr.poly”))
## run the ANOVA
ezANOVA(stim.lng, dv=Alrtns, wid=Snum, within=.(TypeF, DoseF), between=GroupF, detailed=T)
The ezANOVA package is nice, to be sure, looking almost like SPSS. Here’s the output:
$ANOVA
              Effect DFn DFd         SSn      SSd            F            p p<.05        ges
1        (Intercept)   1  14 79900.44444 630.1111 1775.2523364 3.774108e-16     * 0.97162069
2             GroupF   1  14   186.77778 630.1111    4.1498854 6.100363e-02       0.07410265
3              TypeF   2  28   425.93056 599.6389    9.9443647 5.456901e-04     * 0.15434053
5              DoseF   2  28   878.38889 549.8889   22.3635078 1.572069e-06     * 0.27345919
4       GroupF:TypeF   2  28   409.76389 599.6389    9.5669153 6.816385e-04     * 0.14935732
6       GroupF:DoseF   2  28   102.38889 549.8889    2.6067893 9.157840e-02       0.04202917
7        TypeF:DoseF   4  56    45.73611 554.1111    1.1555544 3.402490e-01       0.01922100
8 GroupF:TypeF:DoseF   4  56    26.81944 554.1111    0.6776118 6.103418e-01       0.01136143

$`Mauchly's Test for Sphericity`
              Effect         W            p p<.05
3              TypeF 0.2524563 0.0001300799     *
4       GroupF:TypeF 0.2524563 0.0001300799     *
5              DoseF 0.7586605 0.1660766393
6       GroupF:DoseF 0.7586605 0.1660766393
7        TypeF:DoseF 0.1710604 0.0097290347     *
8 GroupF:TypeF:DoseF 0.1710604 0.0097290347     *

$`Sphericity Corrections`
              Effect       GGe        p[GG] p[GG]<.05       HFe        p[HF] p[HF]<.05
3              TypeF 0.5722318 4.846844e-03         * 0.5898996 4.424443e-03         *
4       GroupF:TypeF 0.5722318 5.547608e-03         * 0.5898996 5.082647e-03         *
5              DoseF 0.8055814 1.231551e-05         * 0.8946538 4.788591e-06         *
6       GroupF:DoseF 0.8055814 1.050485e-01           0.8946538 9.867570e-02
7        TypeF:DoseF 0.5251803 3.308227e-01           0.6200127 3.347825e-01
8 GroupF:TypeF:DoseF 0.5251803 5.225310e-01           0.6200127 5.448314e-01
I also like this better than the car::ANOVA raw output. The problem with long form is contrasts, as was true with strictly repeated-measures designs.
Simple Main Effects
I once again have no desire to get into arguments about terminology for or appropriateness of such analyses. People do them and will continue to do them and I’m just going to leave it at that. The good news is that this time, there actually is a potentially meaningful interaction in the data, and it crosses a between-subjects factor with a within-subjects factor, so there is some possible work to be done in generating the code to handle it.
From visual inspection, what appears to be happening is no effect of drug type in the “no sleep” group with an effect apparent in the “1hr sleep” group. So we’ll do two repeated-measures ANOVAs, one for each group, and looking for the effect of drug type in both cases.
Simple Main Effects in SPSS
This uses the same SORT/SPLIT idiom that we saw with between-subjects ANOVA. The code looks like this:
SORT CASES BY Group.

SPLIT FILE BY Group.

GLM T1D1 to T3D3

/WSFACTOR Type 3 Dose 3.

SPLIT FILE OFF.
And here are the relevant parts of the output. First, sphericity stuff:

And then the actual ANOVA table. Yes, this is getting pretty long:

This shows what we’d expect here, an effect of drug type for the 1hr Sleep group and no effect for the No Sleep group. (Apply all the usual horrible caveats that apply to this type of inference logic.)
Simple Main Effects in R, Wide Format
Just as we used the same idiom we used for between-subjects in SPSS, we will use the same idiom that we used in between-subjects ANOVA in R, which is a for() loop. I know people like to try to vectorize everything in R, but if you ever have enough groups that this really matters for performance reasons, there are other issues. So, the R code looks like this:
for (Grp in levels(stim$GroupF)) {

cat("\n------ Group:", Grp, "-----\n")

SubFrame = stim[GroupF == Grp,]

Anv1 = lm(cbind(T1D1, T1D2, T1D3, T2D1, T2D2, T2D3, T3D1, T3D2, T3D3)~1, data=SubFrame)

Anv2 = Anova(Anv1, idata=data.frame(Type, Dose), idesign=~Type*Dose, data=SubFrame, type=3)

print(summary(Anv2, multivariate=F))

}
That is, iterate through the groups, select the subset of data for that group, then run the repeated-measures ANOVA for each group. It’s not super-clean and there’s probably some better way to do this with some kind of by() statement, but this works well enough for me. Here’s the output:
------ Group: No Sleep -----

Univariate Type III Repeated-Measures ANOVA Assuming Sphericity

               SS num Df Error SS den Df         F    Pr(>F)
(Intercept) 36180      1   127.06      7 1993.3288 7.388e-10 ***
Type            0      2   331.53     14    0.0053 0.9947373
Dose          784      2   345.03     14   15.9077 0.0002488 ***
Type:Dose      19      4   364.89     28    0.3581 0.8361991
---
Signif. codes:  0 ‘***’ 0.001 ‘**’ 0.01 ‘*’ 0.05 ‘.’ 0.1 ‘ ’ 1


Mauchly Tests for Sphericity

          Test statistic  p-value
Type             0.22647 0.011616
Dose             0.51826 0.139202
Type:Dose        0.01185 0.006061


Greenhouse-Geisser and Huynh-Feldt Corrections
 for Departure from Sphericity

           GG eps Pr(>F[GG])
Type      0.56385    0.95905
Dose      0.67488    0.00179 **
Type:Dose 0.37653    0.64898
---
Signif. codes:  0 ‘***’ 0.001 ‘**’ 0.01 ‘*’ 0.05 ‘.’ 0.1 ‘ ’ 1

             HF eps   Pr(>F[HF])
Type      0.5978545 0.9652534118
Dose      0.7785622 0.0009500507
Type:Dose 0.4572805 0.6875468299

------ Group: 1hr Sleep -----

Univariate Type III Repeated-Measures ANOVA Assuming Sphericity

               SS num Df Error SS den Df        F    Pr(>F)
(Intercept) 43907      1   503.06      7 610.9605 4.522e-08 ***
Type          835      2   268.11     14  21.8123 4.996e-05 ***
Dose          197      2   204.86     14   6.7209  0.008995 **
Type:Dose      54      4   189.22     28   1.9935  0.122878
---
Signif. codes:  0 ‘***’ 0.001 ‘**’ 0.01 ‘*’ 0.05 ‘.’ 0.1 ‘ ’ 1


Mauchly Tests for Sphericity

          Test statistic p-value
Type             0.14145 0.00283
Dose             0.86525 0.64777
Type:Dose        0.38241 0.82632


Greenhouse-Geisser and Huynh-Feldt Corrections
 for Departure from Sphericity

           GG eps Pr(>F[GG])
Type      0.53805   0.001702 **
Dose      0.88125   0.012432 *
Type:Dose 0.77327   0.143502
---
Signif. codes:  0 ‘***’ 0.001 ‘**’ 0.01 ‘*’ 0.05 ‘.’ 0.1 ‘ ’ 1

             HF eps  Pr(>F[HF])
Type      0.5578137 0.001460198
Dose      1.1551317 0.008994918
Type:Dose 1.4554011 0.122878219
And again, it all agrees with the SPSS, which is what we’re looking for.
Simple Main Effects in R, Long Format
Again, same idea as between-subjects, using a for() loop, assuming the data now in long format in the “stim.lng” data frame. Code:
for (Grp in levels(stim.lng$GroupF)) {

cat("\n------ Group:", Grp, "-----\n")

print(ezANOVA(stim.lng[stim.lng$GroupF==Grp,], dv=Alrtns, wid=Snum, within=.(TypeF, DoseF), detailed=T))

}
And output:
------ Group: No Sleep -----
Warning: You have removed one or more Ss from the analysis. Refactoring "Snum" for ANOVA.
$ANOVA
       Effect DFn DFd         SSn      SSd            F            p p<.05          ges
1 (Intercept)   1   7 36180.50000 127.0556 1.993329e+03 7.387751e-10     * 0.9687140218
2       TypeF   2  14     0.25000 331.5278 5.278592e-03 9.947373e-01       0.0002139037
3       DoseF   2  14   784.08333 345.0278 1.590766e+01 2.487835e-04     * 0.4015620332
4 TypeF:DoseF   4  28    18.66667 364.8889 3.580999e-01 8.361991e-01       0.0157237119

$`Mauchly's Test for Sphericity`
       Effect         W           p p<.05
2       TypeF 0.2264721 0.011615672     *
3       DoseF 0.5182605 0.139201627
4 TypeF:DoseF 0.0118548 0.006060616     *

$`Sphericity Corrections`
       Effect       GGe       p[GG] p[GG]<.05       HFe        p[HF] p[HF]<.05
2       TypeF 0.5638479 0.959053605           0.5978545 0.9652534118
3       DoseF 0.6748825 0.001789689         * 0.7785622 0.0009500507         *
4 TypeF:DoseF 0.3765304 0.648979117           0.4572805 0.6875468299


------ Group: 1hr Sleep -----
Warning: You have removed one or more Ss from the analysis. Refactoring "Snum" for ANOVA.
$ANOVA
       Effect DFn DFd         SSn      SSd          F            p p<.05        ges
1 (Intercept)   1   7 43906.72222 503.0556 610.960464 4.522047e-08     * 0.97414690
2       TypeF   2  14   835.44444 268.1111  21.812267 4.996251e-05     * 0.41757723
3       DoseF   2  14   196.69444 204.8611   6.720949 8.994918e-03     * 0.14442178
4 TypeF:DoseF   4  28    53.88889 189.2222   1.993541 1.228782e-01       0.04420242

$`Mauchly's Test for Sphericity`
       Effect         W          p p<.05
2       TypeF 0.1414489 0.00283008     *
3       DoseF 0.8652485 0.64777264
4 TypeF:DoseF 0.3824079 0.82631913

$`Sphericity Corrections`
       Effect       GGe       p[GG] p[GG]<.05       HFe       p[HF] p[HF]<.05
2       TypeF 0.5380535 0.001701661         * 0.5578137 0.001460198         *
3       DoseF 0.8812502 0.012431675         * 1.1551317 0.008994918         *
4 TypeF:DoseF 0.7732682 0.143501506           1.4554011 0.122878219
Yes, there are warning messages, but they’re not important here. Again, agrees with the previous two results, so that’s good. (Note that it is possible in R to change the number of decimals output, but then it messes up other procedures that make assumptions. This is just pure stupid. R people seem to not understand basic UI principles like “the default settings are the UI 90% of the time.”) Anyway, this works as well, with somewhat more compact if over-decimaled output.
Interaction Contrasts
As noted in previous posts, I think this is a dramatically better way of handling the interpretation of interactions. In this particular case, the relevant interaction contrast is pretty clear, since there are only two levels of Group, meaning there’s only one contrast there, (1 -1). The contrast on drug type is (1 -2 1), since it appears that the second type is the one that’s different in the 1hr Sleep condition. So we’ll build that in both packages.
Interaciton Contrats in SPSS
As far as I can tell, the best way to handle interactions that involve both within- and between-subjects factors is to compute new variables on the between-subjects contrasts, and then run those through the appropriate between-subjects ANOVA with the appropriate contrasts there. That’s trivial in this case because there are only two levels of the between-subjects variable. The code is thus pretty easy:
COMPUTE T1 = MEAN(t1d1, t1d2, t1d3).

COMPUTE T2 = MEAN(t2d1, t2d2, t2d3).

COMPUTE T3 = MEAN(t3d1, t3d2, t3d3).

COMPUTE T2vs13 = T1 - 2*T2 +T3.

EXECUTE.

ONEWAY T2vs13 BY Group.
And the output is straightforward:

We reject the null here and conclude the contrast characterizes the interaction successfully.
Interaction Contrasts in R, Wide Format
It turns out that in wide format, the way to do this in R looks a lot like SPSS. The main difference is that there are ways to shortcut this in R with matrix operations. I’ll show the most SPSS-like way of doing it and the matrix version to better satsify the R purists (and myself, as this is much cleaner). Here’s the SPSS-like code:
T1 = (T1D1 + T1D2 + T1D3)/3

T2 = (T2D1 + T2D2 + T2D3)/3

T3 = (T3D1 + T3D2 + T3D3)/3

T2vs13 = T1 - 2*T2 +T3

summary(aov(T2vs13 ~ GroupF))
And here’s the vector-multiplicaiton way:
LVec = rep(c(1, -2, 1), 3)

T2vs13 = cbind(T1D1, T2D1, T3D1, T1D2, T2D2, T3D2, T1D3, T2D3, T3D3) %*% LVec

summary(aov(T2vs13 ~ GroupF))
They both produce the same output:
            Df Sum Sq Mean Sq F value Pr(>F)
GroupF       1   7353    7353   10.35 0.0062 **
Residuals   14   9943     710
---
Signif. codes:  0 ‘***’ 0.001 ‘**’ 0.01 ‘*’ 0.05 ‘.’ 0.1 ‘ ’ 1
And, hooray, it matches SPSS. Excellent.
Interaction Contrasts in R, Long Format
This simply does not work in R, as far as I can tell. This is exactly the same problem that I run into with the pure repeated-measures version, and I still have no idea what the problem is or why it occurs. The most frustrating part is that R doesn’t produce any error messages or anything, it just fails to put things in the output. It’s bizarre, annoying, and makes me mistrust R, which is not where you want to be with your statistics package.
My iOS Apps, 2014 Edition
So, the list of Mac apps hasn’t changed all that much since I last did this in 2012. I’m still using many of the same iOS apps, but there’s been more churn there, and so I’m going to re-do the list from scratch, but using the same categories as the 2012 list. New entries are marked with an asterisk.
Hardware
First, though, my current iOS hardware. I am still on the every-other-year plan for most of these, and so this year I just got an iPhone 6. I am still using last year’s iPad, though, a 1st-generation iPad Air. I’ve made some comments about the phone elsewhere and I’m still in love with the iPad Air, which is just a fantastic little machine. When I really need a keyboard for the iPad I just use the little AmazonBasics Bluetooth keyboard, which is portably small but does not have the keys in weird places like many other small bluetooth keyboards (in particular, many of them have the “up arrow” key next to the “shift” key in such a way that mistyping up arrow for shift is simply way too common.
5 Must-Haves
These are the apps I’d miss the most if they went away:
- GoodReader. It is still true that the thing I most do on my iPad is read, especially journal manuscripts and student papers. I still love this for marking up PDFs and the developer has not only done a great job of keeping up with the latest iOS stuff, but it’s now a universal app for both iPad and iPhone, which is a real win.
- OmniOutliner 2. Still one of the greatest pieces of software on the Mac (that and BBEdit), and while the iPad version is still not quite all I would want it to be, it’s still a vital tool for me. The added bonus is that an iPhone version is planned for 2015—I’m really looking forward to that.
- 1Password. Still the king of password management, working across iOS and MacOS in a seamless way. Rocks the house.
- Check the Weather. Still my favorite weather app, though the free Forecast.io site is now pretty reasonable competition.
- Decked Builder. What can I say, I’m an MTG nerd.
Cross-Device
Some of the best other apps I use work on both iPhone and iPad, and I use them both places. Some of them you actually have to download two apps, one for each device, but some of these “just work” on both. In cases where there is more than one version, the link goes to whichever device I use the app on most. This is in alphabetical order, not by priority or anything.
- Drafts 4. I actually find this version slightly worse than Drafts 3, but the things that make it worse are just violations of my own personal preferences (I don’t want to let Facebook crap all over my address book by linking it to the OS). Otherwise, still great. Oh, what is it, you ask? It’s a text utility—you get a blank page, start writing, and then later figure out where you want the text to go, such as Twitter, Facebook, Dropbox, email, etc.
- Draw Pad Pro. If you need a quick sketch with your finger, this is the way to go on iOS. The 3.0 update was a real advance, and now I like it better than Penultimate.
- Evernote.* Since I dumped SpringPad, this is the new cross-platform note system of choice.
- Movies by Flixster. Still my go-to app for movies.
- Parcel.* I use this to track deliveries. I’ve heard good things about the “Deliveries” app as well, but Parcel was free. I’ve since upgraded to a premium subscription, but that’s still cheaper.
- PCalc. There might be other calculator apps out there, and they might be good. But PCalc is awesome and has been awesome for a really long time, and I have no plans to go another way unless the developer shuts down.
- Prizmo.* I don’t use this a lot, but I’m always glad to have it when I need it. Great little OCR app.
- SoundHound. I’ll say what I said in 2012: I know Shazam is more popular for identifying songs, but I seem to get better results with SoundHound. There is both a free and a paid version of this app, and I got the paid version when it was either free or $1. Not sure what the difference is, but the one I have does what I want.
- theScore.* I used to use ESPN’s “ScoreCenter” to track sports scores, but the iPad version sucked very hard, and when it started to require an account, meh. theScore is actually only OK. The UI is good, but the server it uses is unreliable. Open for other suggestions on this one.
- Tweetbot. This used to be on my “must-have” list but the free Twitter client has caught up a lot, and the iPad version of this is lagging pretty far behind, so if I were to start today I’m not sure if I would buy this or not.
- Wikipanion. If I’m at my computer and have my iPad handy, it’s a tossup which I’ll use to look something up on Wikipedia. A very nice front end, and free.
Notably absent from this list is Notesy, which used to be a favorite but is in dire need of an update for iOS 8. And again, while I have OmniFocus on both devices, I’m really still looking for a good to-do list app, as OmniFocus seems a little too much for me. I also have the Apple suite of Pages, Numbers, etc. but I don’t use them very often under iOS. And like in 2012, I rely on Dropbox as a service, but I rarely actually use the app.
iPhone Only
There are more changes here than anywhere else, driven in no small part by the step-tracking ability of my most recent phone.
- Camera+. I still usually take pictures with the built-in app, but there are times when I want this because it’s easier to shoot one-handed with this than the default app. Also, with iOS 8, Camera+’s filters are available in Apple’s photos app, and that alone is worth the price. And still some of the best release notes anywhere.
- Fantastical 2.* This is available for iPad as well, but there I find Apple’s calendar to be just fine there, but on the iPhone Apple’s calendar just isn’t even close to Fantastical.
- FitPort.* Yes, I actually paid money for what is basically a better presentation of Apple’s health data. Decent software is worth money, so I don’t mind this at all.
- United.* Pretty good airline app. I fly almost exclusively on United because I live in one of their hub cities, and while lots of people seem to like Southwest, I’ve consistently had bad experiences with them. United is actually pretty awful, too, but at least their iPhone app doesn’t suck.
- Walkmeter.* OK, so one of the big changes for me this year is that we now have a family dog. I really enjoy walking her, and am shooting for 3 miles a day. Best tracking app I’ve found, though most of them I delete right away since they either require a log in or ask for personal information, neither of which are in any way necessary for performing the function of GPS tracking a walk route, so they all got deleted immediately.
iPad Only
- iBooks. Still my favorite ebook platform, but again, I don’t read much on my phone.
- Instapaper. Still my favorite “read later” service, and again, while there is an iPhone version of it, I never use it there.
- Feedly.* Since Google Reader died, I just use Feedly. I dislike their Web app on the desktop and use ReadKit there, but on the iPad their free reader is good enough.
- MacJournal. This app is getting to feel long in the tooth with its archaic Wifi sync and separate iPhone and iPad versions, but I still use it regularly, so here it is. If Day One supported encryption, I’d probably drop this, but it doesn’t, so I haven’t.
- Twitch.* I know I mentioned earlier that I’m an MTG nerd, and this app is now stable enough that I’m willing to list it. Already missing Legacy on Sunday nights from SCG. <sigh>
Under Consideration
There are a few pieces of software I’m considering buying, or have recently installed and am considering whether or not they deserve more prime-time love.
- Editorial. Supposed to be the hot editor on the iPad now, and with Notesy bowing out of the game, this might become my go-to.
- Launch Center Pro. I got this on sale for $1 and it looks intriguing, but maybe not enough of a win to bother with configuration, which could be time-consuming.
- Todoist. Giving this a try as a to-do list manager. Pretty unthrilled with the Mac desktop version so far, but the iOS version seems better.
I’m not going to bother with a full “Games” category this time since it’s pretty much just Ascension and Civilization Revolution 2 on the iPad and very little else these days.
So, what critical things am I missing? Anyone got a to-do list manager that they love (not including OmniFocus, Things, or Clear, all of which I’ve tried and am just not into)?
My Mac Apps, 2014 Edition
So, two years ago, I thought I’d start an annual series on the apps that I use on Mac OS and on iOS. I didn’t update either of them at the end of 2013 because not much had changed. On the Mac side, that’s still surprisingly the case.
So, instead of re-iterating the whole list, which hasn’t changed much (go read that first), I want to highlight what’s new to the fold and what’s been dropped.
New Hardware
Only two changes, but they’re pretty big
• It was finally time to get a new home machine, so I’m now on a shiny still-feels-new late-2013 Mac Pro that I still call “the wastebasket.” It’s gotten more stable with each update of Mavericks (I finally just upgraded to Yosemite yesterday) and I’ve gone from being mostly unhappy with it (despite the blazing speed) to now tolerating it. Still flaky for a lot of USB things from time to time, but overall most of the kinks are out.
• I’m now using a CODE Keyboard, the model with the Cherry MX Clear switches (105 keys). The feel is very good. It’s still not as quiet as I’d like, but it’s tolerable. I actually still keep the old Logitech DiNovo Edge around for when USB dies on the wastebasket or when I’m on a telecon and really need a quiet keyboard. I wasn’t sure how I’d like this, but within a week or two of having one at home, I had to buy a second one for my campus office.
• The one downside to the CODE keyboard is the lack of, or rather somewhat klunky solution for, media keys. Thus, I un-mothballed my Griffin PowerMate for handling audio controls. Works fine under Yosemite, too.
New Software
Again, surprisingly little has been added to the fold here over the last two years. The Big 5 are still BBEdit (now at version 11, which is a highly-recommend upgrade), OmniOutliner Pro (now with the useful OmniPresence and hopefully with an iPhone version coming soon), LaunchBar, Keyboard Maestro, and Dropbox (though I rely on this slightly less now).
However, there are a few new things that have made appearances:
• DEVONthink Pro Office. Probably overkill for what I use it for, but it has its uses. In particular, I use it to archive old email, to manage my PDF library of academic journal articles, and as a storehouse for scanned documents.
• Evernote. Last time around, I was using SpringPad for cross-platform storage of notes and snippets, because the Evernote TOS were horrible. They’ve changed their TOS and the software has improved a lot as well, so I’ve been using this a little in place of the defunct SpringPad. Again, this seems like a powerful tool that I’m only scratching the surface on.
• ReadKit. I’m one of those holdouts who still reads a lot of Web content via RSS. With the death of Google News, I needed a new client, and this was the one I went with. Nothing to rave about, but no complaints, either, and since I am indeed one to complain about crappy software, that’s saying something.
• Bartender. Laptop displays just aren’t big enough for all the crap in my menubar these days. Well, with this, it’s all good.
Software Gone or on the Way Out
In addition to the small number of new things, there are pieces of software on the 2012 list that I either don’t use anymore or am in the process of getting rid of. I’ll provide a brief explanation of the issue with each one.
• Yojimbo. Ahh, Yojimbo. This is actually one of my favorite pieces of software—so why drop it? Because, essentially, data stored here is trapped on the Mac. Technically, there’s a version of Yojimbo on the iPad, but it is, unfortunately, not very good and it never syncs properly with the Mac version—and the sync is manual rather than automatic. Bare Bones offers a sync service for Yojimbo but that’s only between Macs and has a monthly fee. This is just not a tractable situation, so I’m going to be migrating to a mix of other applications: 1Password for software serial numbers and passwords, DEVONthink for PDFs that I don’t need mobile access to, and probably Evernote for short notes and other miscellany. It’ll be a very, very sad day when I complete all this, but I think it’s necessary. When I travel not for work I don’t bring a Mac, and I’ve just had too many recent episodes where there’s data I need, but it’s stuck in Yojimbo and I can’t get to it. Sad but them’s the breaks.
• RStudio. I use R more than ever (but still not for big repeated measures analysis, alas), but I have given up on RStudio. Basically, while I like the IDE framework and some of the tools, the editor is just a piece of crap that has years-old known bugs in it that I just couldn’t stand anymore, so now I just use BBEdit and the raw R software. There are things I miss about RStudio, but not enough to justify going back to it.
• NetNewsWire. My favorite old RSS reader just would not keep up with the times. No Feedly or any other form of cross-machine/cross-device sync? Really? In 2014? Bye.
• OmniGraphSketcher. When the company that makes it stops, it’s time to give up. Not much of a loss, though, really.
• Interarchy. It’s not that there’s anything wrong with it—I haven’t replaced it or anything—I just find that I never use it anymore.
Under Consideration
While I still like MacJournal, it’s a little limited as a blogging tool when you want to mix images and things like code snippets, so I’m thinking about taking the plunge with something like MarsEdit or Desk.
The other thing that I’m still searching for is a good to-do list manager—just like I was at the end of 2012. I own OmniFocus but I basically never use it because it’s just so klunky. It’s tied to the GTD productivity cult, which I guess is OK, but I’m not really into that, so it’s just extra hassle. I’m told Things has similar issues. Basically, what I need in a to-do list manager is:
- Hierarchical lists that can be re-organized by dragging (not by “priority values” or due dates whatever OmniFocus uses)
- Dated, recurrent items (but dates don’t force order in the list)
- Automatic sync between Mac, iPad, and iPhone
- No GTD cruft, or at least the ability to ignore that stuff
- It would be nice if it didn’t cost a small fortune like OmniFocus (and Things)
Right now I basically just use OmniOutliner to keep a list because it’s the best hierarchical list editor I have access to, but it doesn’t have recurrent items and doesn’t sync invisibly with my iPhone, so that’s why I’m still looking. I’m planning on checking out Todoist and Clear. What else should I look at? I tried Wunderlist but it doesn’t handle hierarchy in a way that works for me.
Quick Review: So, How Do You Like Your New Phone?
So, a week ago, I got an iPhone 6, and since then, I’ve gotten this question a lot. Some initial thoughts/reactions:
Size
I’m going to come right out and say it: it’s just a little bit too big. I wasn’t unhappy with the size of the 5 I upgraded from and was not one of those people clamoring for a bigger phone. In fact, I had some misgivings about the larger size. Overall I don’t hate it or anything, but it’s just a little bit bigger than I would have liked. If Apple could have figured out some way to split the difference between the 5 series and this, I think that would have been fine. The fact that it’s so thin does help offset the overall size, but I don’t have particularly large hands and I use my phone one-handed pretty often, and it’s just a smidge too big at times. The double-tap on the home button (not a double press, but a really light double-tap) to scroll the top of the display down so you can reach it one-handed is something, but just doesn’t seem like quite enough of a solution.
The one real up side to the larger phone is the increase in the number of apps that appear on the first page of home. I do like that a lot, but otherwise I’d actually like it to be just a bit smaller. I could not imagine getting a 6+, but I would guess that the people who are interested in such a thing have a somewhat different usage profile. (I already have, and love, my full-sized iPad, and I’m not really in the market for a middle-sized device. I kind of don’t get the iPad Mini, either, but again, I’m not the target user.)
Favorite Features
The top of the list is Touch ID, no contest. This is not a new feature on the iPhone, but it’s a new feature for me, since I’m coming from a 5, not a 5S. I simply love this. I understand it’s not 100% secure, but neither is a 4-digit PIN, and this is probably at least as good as that, which is what I had before. I know I can use a longer PIN, but my threat model is not a dedicated hacker, but rather me leaving my phone somewhere and a casual passerby picking it up. Touch ID is so fast and so easy. This totally rocks.
My second favorite thing is the better camera. I’m not really much of a photographer, but it’s always nice to be able to not think about it and just have the thing take better pictures. And this camera seems to do better for me, and I’m not even trying to do crazy awesome stuff like in Iceland.
The other thing I love is that it’s blazing fast. The 5 was no slouch and I wasn’t actually unhappy with the speed and itching to move up to a faster phone (I had that in spades when I replaced my first iPhone, a 3G), but this thing just screams—everything is just so responsive. I find the whole “oh, everything on the iPhone 6 has been available on Android for a year now” thing really annoying. Tell me, which Android phone benchmarked like this a year ago? And still has decent battery life? Yeah, that’s what I thought. Dumb lazy argument is dumb and lazy.
Next is the motion co-processor. I’ve never invested in a FitBit or anything, but now that we have a dog I go for a decent walk every day and it’s interesting to see the step count. Again, not new to the 6, but not something that was available on the 5, and I like it.
Oh, and one more win for Apple on this is the increase in storage. The mid-priced phone (which is what I usually get) went up from 32G to 64G, which is awesome. I was really pushing on the 32G on my 5, and it’s nice to have some breathing room.
The Display
The screen is truly excellent. The screen on my 5 was perfectly good, but this seems even better. I didn’t go with a 6+, which I’ve heard has an even better screen, but this one still seems great. Of course, it’s also bigger, but I’ve already covered that. The thing about the bigger and even higher-quality display is that I find myself slightly less drawn off the phone to do reading-based tasks, which is really what my iPad is for—serious reading. I never, for instance, read books on my phone. Now I might. The only down side here is that apps that haven’t been updated for the new screen size look a little clunky—the text looks huge on these. I’m sure most of them will sort it out relatively soon.
Battery Life
No contest that this is much better than on my 5. Battery life on the 5 was always decent, but nothing great, and so far the 6 just blows it away. In normal usage so far, I’ve never even come close to needing to charge it during the day. (I charge my phone every night while I’m asleep.) I didn’t often need to charge the 5 before the end of the day, either, but I don’t think I’ve even gotten the battery down below half. Very nice work. I guess this is the other upside for the larger form factor—space for a bigger battery.
iOS 8
Technically, iOS 8 is not really an iPhone 6 feature in that I had already installed it on my 5 and my iPad the day before I got my 6, but the 6 requires it and so I kind of think of it that way. So far, it just doesn’t seem that much different than iOS 7 (which I thought was a very mixed bag vs. iOS 6—some things got better, but some got worse). HealthKit isn’t really active yet (oops), other than the basics (although as I mentioned, I like the step tracking).
So far there aren’t enough extensions for that to be a big deal, though I am tickled to see PCalc in the “today” view. This will probably pick up as more apps are updated for iOS 8. I think photo editing on-camera via extensions is probably going to be a big deal.
The predictive keyboard is actually pretty nice. It’s not always accurate, of course, but where I find it particularly shines is when it correctly predicts words that have punctuation (for example, “we’ll”) in them, because punctuation sucks on a mobile keyboard. I haven’t tried any of the third-party swipe-based keyboards yet, and I’m not sure that I will because I don’t often type anything substantial with one finger, and as John Gruber observed, I’m not sure how much that’ll do for two-thumb typing. Plus, given the larger form factor, I think I’m even more likely to two-thumb type than before. We’ll see.
The tweaks to Messages and Mail are all nice, but not anything major. Family Sharing and Continuity are not things I can use because my Macs aren’t on Yosemite yet and the rest of my family isn’t on iOS 8 yet. Continuity seems cool, though, but we’ll have to see how it really plays out—the devil is in the details, and I haven’t yet gotten to play in the details.
The place where I think Apple really blew it is with iCloud Drive. I’m going to just come out and say it: Apple is generally not good at the whole cloud thing. I used to think Apple should have worked harder to buy Dropbox because of how awesome Dropbox is, but now I’m really glad they didn’t—I think Apple probably would have screwed it up. Anyway, when you install iOS 8 for the first time, it prompts you for whether or not you want to upgrade your iCloud account to iCloud Drive. The idea of iCloud Drive isn’t exactly new for Apple (remember iDisk?), and the warning it gives you is pretty tame, but in fact if you agree to “upgrade” to iCloud Drive, it effectively hoses your iCloud storage if you access iCloud from a Mac that isn’t running Yosemite. Since Yosemite isn’t actually released yet, this is a really bad idea. As an added bonus, this “upgrade” isn’t undo-able. Ugh. Would it really have been that hard for Apple to have put in another layer of warning that said something like “You should only do this if you run Yosemite on your Mac” and defaulting to “no, don’t upgrade” rather than defaulting to “upgrade?” Any decent UX person knows that users frequently don’t read warnings very carefully and that the default should never be to mess up something that already works.
Overall
So, while I find the new larger form-factor not quite ideal and iOS 8 to be a mixed bag, on the whole I’m pretty happy with the new phone. I’m pretty inelastic on this, because I use my phone constantly (usually not as an actual phone, of course), so I’m bad with concepts like “is it worth the $300?” but on balance I certainly don’t regret the purchase.
Background Notes
I’m on the every-other-year plan with the iPhone. I didn’t get the original but have stuck to that plan otherwise, so I have had a 3G, a 4, and a 5 previous to this. I’ve never had an “S” model (3GS, 4S, 5S), but my wife is on the every-other-year plan on the “S” cycle, but she started later, so she used to have a 4S and now has a 5S. So I’ve at least fiddled with every model except for the original and the 3GS.
Translating SPSS to R: Factorial Repeated Measures
As I noted in the last blog post, R is not terribly well-situated for repeated measures. This becomes increasingly true as the designs become more complicated. This post will cover a simple two-way repeated-measures ANOVA, so it won’t be all that bad, but even here there will start to be a few complications in places.
The data, which can be found in wide format in elashoff.xls, is a “famous” data set that has appeared in numerous textbooks from Elashoff (1981) “Data for the panel session in software for repeated measures analysis of variance.” It is actually a mixed design (there’s a between-subjects variable), but I’m going to ignore the between-subjects for now in the name of pedagogy. The within-subjects part of the study is a 3 x 3 design with three different types of drugs given at three different dosages. My vague recollection is that the context is that these are stimulants and the dependent measure is some measure of alertness.
The data file has 11 variables in it: the subject number, the group number (for the between-subjects group, which we’re going to ignore for now), and then the 9 observations on each subject. These are noted “TxDx” for “type x” and “dose x” respectively, so “T2D3” is drug type 2 at dosage level 3.
The results look like this:

(No, I didn’t use either SPSS or R to make the graph. I hate both of them for graphing for totally different reasons. That graph was made with DeltaGraph.)
Basic Factorial ANOVA
Basic ANOVA in SPSS
SPSS has the virtue of making easy things easy. (This is accompanied by sometimes making things of moderate difficulty hard to impossible and hard things unthinkable, but I digress.) The SPSS code to do a simple two-way repeated-measures ANOVA on these data is simply this:
GLM T1D1 TO T3D3

/WSFACTOR Type 3, Dose 3.
There are two features of import here. First, SPSS offers the convenience of not listing out all the variables used, allowing the use of “TO” to indicate a list from one variable to another. Second, the WSFACTOR subcommand that creates the within-subjects independent variables. These names are order-dependent, and listing them in the wrong order will cause SPSS to analyze the data incorrectly, but without issuing any kind of error message. The good news is SPSS provides some output to give the user a fighting chance to catch if this was done wrong:

This table shows how each level of each independent variable is mapped to each variable in the data file. Very handy. Next in the output is a bunch of multivariate tests, which I always ignore, and then the sphericity diagnostics, as per the one-way output, but of course now there are more of them:

The data are pretty non-spherical, particularly things on the “Type” factor. Looks like GG adjustment is appropriate on Type and the interaction, and HF on the Dose effect. Those effects are all shown in the next (fairly large) table:

Looks like both main effects are reliable and the interaction is not. Pretty unsurprising given the graph. As noted last time, SPSS also produces output for contrasts, defaulting to assuming that all factors are amenable to trend analysis. For pedagogical reasons, I rather wish SPSS wouldn’t do this, as students frequently look at this and try to report something from it even when it’s completely irrelevant. (In this particular case it might be relevant for “Dose” but is clearly meaningless for “Type” since that’s obviously categorical.) Anyway, here’s what that looks like:

Whatever. Not my favorite, but not too damaging. Now, let’s see this in R, in both wide and long format.
Basic ANOVA in R, Wide Format
Not surprisingly, this is more complicated, though it’s not really all that bad for a two-way design. The basic issue in generating the code is that that SPSS generates the factorial design for you, and with R you kind of have to build that yourself (though I suspect there’s an easier way to do this, I haven’t found it yet). Here’s the code:
## Create a model of the within-subjects factors

Anv1 = lm(cbind(T1D1, T1D2, T1D3, T2D1, T2D2, T2D3, T3D1, T3D2, T3D3)~1)
## Create labelled factors for w-s factors
Type = factor(c(“T1”, “T1”, “T1”, “T2”, “T2”, “T2”, “T3”, “T3”, “T3”))
Drug = factor(c(“D1”, “D2”, “D3”, “D1”, “D2”, “D3”, “D1”, “D2”, “D3”))
## shorter, but equivalent, way to do this
Type = factor(c(rep(“T1”, 3), rep(“T2”, 3), rep(“T3”,3)))
Dose = factor(rep(c(“D1”, “D2”, “D3”), 3))
## do the ANOVA. “idata” and “idesign” tell Anova() how to
## structure within-subjects factors
library(car)
Anv2 = Anova(Anv1, idata=data.frame(Type, Dose), idesign=~Type*Dose, type=3)
summary(Anv2, multivariate=F)
This produces output that isn’t quite as clean as SPSS, but does match it in all the important ways:
Univariate Type III Repeated-Measures ANOVA Assuming Sphericity

               SS num Df Error SS den Df         F    Pr(>F)
(Intercept) 79900      1   816.89     15 1467.1600 2.226e-16 ***
Type          426      2  1009.40     30    6.3294   0.00509 **
Dose          878      2   652.28     30   20.1997 2.775e-06 ***
Type:Dose      46      4   580.93     60    1.1809   0.32836
---
Signif. codes:  0 ‘***’ 0.001 ‘**’ 0.01 ‘*’ 0.05 ‘.’ 0.1 ‘ ’ 1


Mauchly Tests for Sphericity

          Test statistic  p-value
Type             0.17795 0.000006
Dose             0.69506 0.078368
Type:Dose        0.19903 0.010585


Greenhouse-Geisser and Huynh-Feldt Corrections
 for Departure from Sphericity

           GG eps Pr(>F[GG])
Type      0.54883    0.02041 *
Dose      0.76632  2.888e-05 ***
Type:Dose 0.54621    0.32290
---
Signif. codes:  0 ‘***’ 0.001 ‘**’ 0.01 ‘*’ 0.05 ‘.’ 0.1 ‘ ’ 1

             HF eps   Pr(>F[HF])
Type      0.5597129 1.973144e-02
Dose      0.8361743 1.430901e-05
Type:Dose 0.6429432 3.258431e-01
The thing I really miss is the diagnostic about levels—if you mess this up, you get the wrong output and no way of knowing this happened. However, not a surprise that SPSS is more user-friendly than R on pretty much any score (except price, of course, and speed).
Basic ANOVA in R, Long Format
Step 1 is to turn the wide-format data into long-format data. This is not terribly hard in general, but there are some complications. In particular, for multi-factor one-way designs, the variable that holds the condition holds the full condition name, and that has to be broken down into separate variables. I usually do this by just extracting substrings, but this only works if you’re disciplined in your naming conventions. I am, but not everyone is, so when I get data from other people, it’s almost always extra work, but it’s not generally too bad. Anyway, here’s the R code:
## melt into long form

library(reshape2)

stim.lng = melt(stim, id=c("Snum", "Group"), variable.name = "Cond", value.name="Alrtns")
## code separate factors for Type and Dose

stim.lng$TypeF = factor(substr(stim.lng$Cond, 1, 2))

stim.lng$DoseF = factor(substr(stim.lng$Cond, 3, 4))
## Make Snum into a factor
stim.lng$Snum = factor(stim.lng$Snum)
## run ANOVA
library(ez)
ezANOVA(stim.lng, dv = Alrtns, wid = Snum, within = .(TypeF, DoseF), detailed=T)
And here’s the output:
$ANOVA
       Effect DFn DFd         SSn       SSd           F            p p>.05        ges
1 (Intercept)   1  15 79900.44444  816.8889 1467.159956 2.226286e-16     * 0.96312076
2       TypeF   2  30   425.93056 1009.4028    6.329444 5.089509e-03     * 0.12220314
3       DoseF   2  30   878.38889  652.2778   20.199727 2.775105e-06     * 0.22306086
4 TypeF:DoseF   4  60    45.73611  580.9306    1.180936 3.283603e-01       0.01472871

$`Mauchly's Test for Sphericity`
       Effect         W            p p>.05
2       TypeF 0.1779497 5.650424e-06     *
3       DoseF 0.6950563 7.836821e-02
4 TypeF:DoseF 0.1990287 1.058467e-02     *

$`Sphericity Corrections`
       Effect       GGe        p[GG] p[GG]>.05       HFe        p[HF] p[HF]>.05
2       TypeF 0.5488323 2.040935e-02         * 0.5597129 1.973144e-02         *
3       DoseF 0.7663166 2.887647e-05         * 0.8361743 1.430901e-05         *
4 TypeF:DoseF 0.5462132 3.229028e-01           0.6429432 3.258431e-01
Because in long form there are no order issues, the problem of mis-ordering the independent variables doesn’t come up, so no worries on that front. I still wish it did the d.f. adjustment for sphericity, but I’ll live.
Simple Main Effects
First, yes, I understand that’s not the terminology of choice for everyone. I discussed that in my post on factorial between-subjects ANOVA. I’m sticking with it. I also get that this isn’t always a great way of decomposing an interaction (In fact, it’s often seriously flawed), but I’m still going to illustrate it for completeness. I am not, however, going to do cell posthocs because they’re awful.
Second, I further understand that that is not really the optimal data set for illustrating this, because there isn’t really any evidence of an interaction. An oversight on my part, perhaps, but it’s a pretty well-known data set—let’s just go with these are the procedures that would be used were there a meaningful interaction, and all agree that they aren’t really appropriate for these data and give that a pass for pedagogical purposes. OK?
Simple Main Effects in SPSS
Unfortunately, the SPLIT… SORT construct that makes this easy to do in between-subjects ANOVA doesn’t work for repeated-measures data in SPSS. It’s not that bad, but it’s sort of tedious. Let’s say we wanted to look for the effects of Dose at the different levels of Type of drug. That would look like this:
GLM T1D1 T1D2 T1D3

/WSFACTOR Dose 3.
GLM T2D1 T2D2 T2D3
/WSFACTOR Dose 3.
GLM T3D1 T3D2 T3D3
/WSFACTOR Dose 3.
In each individual ANOVA, only a subset of the nine measures is used, and at each one, we test for an effect of Dose. Since there’s no interaction and a substantial main effect of Dose, we expect to reject the null in all three cases, and that’s what we get (in three pieces). Here’s the output for drug Type 1:

And for drug Type 2:

And for drug Type 3:

Obviously, if we were decomposing an interaction we’d be looking for some of these ANOVAs telling us to reject and others not.
Simple Main Effects in R, Wide Format
The basics for doing this in R are exactly the same as they are for doing this in SPSS—we do three separate ANOVAs by including only some of the variables in each one.
Dose = factor(c("D1", "D2", "D3"))
T1Anv = lm(cbind(T1D1, T1D2, T1D3)~1)
summary(Anova(T1Anv, idata=data.frame(Dose), idesign=~Dose, type=3), multivariate=F)
T2Anv = lm(cbind(T2D1, T2D2, T2D3)~1)
summary(Anova(T2Anv, idata=data.frame(Dose), idesign=~Dose, type=3), multivariate=F)
T3Anv = lm(cbind(T3D1, T3D2, T3D3)~1)
summary(Anova(T3Anv, idata=data.frame(Dose), idesign=~Dose, type=3), multivariate=F)
Same idea as SPSS, but wordier. Here’s the output in one big chunk:
Univariate Type III Repeated-Measures ANOVA Assuming Sphericity

                 SS num Df Error SS den Df       F    Pr(>F)
(Intercept) 23585.3      1   144.67     15 2445.48 < 2.2e-16 ***
Dose          386.8      2   277.21     30   20.93  2.04e-06 ***
---
Signif. codes:  0 ‘***’ 0.001 ‘**’ 0.01 ‘*’ 0.05 ‘.’ 0.1 ‘ ’ 1


Mauchly Tests for Sphericity

     Test statistic    p-value
Dose        0.28979 0.00017161


Greenhouse-Geisser and Huynh-Feldt Corrections
 for Departure from Sphericity

      GG eps Pr(>F[GG])
Dose 0.58472  0.0001503 ***
---
Signif. codes:  0 ‘***’ 0.001 ‘**’ 0.01 ‘*’ 0.05 ‘.’ 0.1 ‘ ’ 1

        HF eps   Pr(>F[HF])
Dose 0.6041376 0.0001227022

Univariate Type III Repeated-Measures ANOVA Assuming Sphericity

               SS num Df Error SS den Df      F    Pr(>F)
(Intercept) 32396      1  1360.31     15 357.23 7.147e-12 ***
Dose          384      2   318.62     30  18.08 7.046e-06 ***
---
Signif. codes:  0 ‘***’ 0.001 ‘**’ 0.01 ‘*’ 0.05 ‘.’ 0.1 ‘ ’ 1


Mauchly Tests for Sphericity

     Test statistic p-value
Dose        0.91258 0.52712


Greenhouse-Geisser and Huynh-Feldt Corrections
 for Departure from Sphericity

      GG eps Pr(>F[GG])
Dose 0.91961  1.466e-05 ***
---
Signif. codes:  0 ‘***’ 0.001 ‘**’ 0.01 ‘*’ 0.05 ‘.’ 0.1 ‘ ’ 1

       HF eps  Pr(>F[HF])
Dose 1.042018 7.04624e-06

Univariate Type III Repeated-Measures ANOVA Assuming Sphericity

                 SS num Df Error SS den Df         F   Pr(>F)
(Intercept) 24345.0      1   321.31     15 1136.5114 1.48e-15 ***
Dose          153.3      2   637.38     30    3.6076  0.03945 *
---
Signif. codes:  0 ‘***’ 0.001 ‘**’ 0.01 ‘*’ 0.05 ‘.’ 0.1 ‘ ’ 1


Mauchly Tests for Sphericity

     Test statistic p-value
Dose        0.75338 0.13775


Greenhouse-Geisser and Huynh-Feldt Corrections
 for Departure from Sphericity

      GG eps Pr(>F[GG])
Dose 0.80217    0.05146 .
---
Signif. codes:  0 ‘***’ 0.001 ‘**’ 0.01 ‘*’ 0.05 ‘.’ 0.1 ‘ ’ 1

        HF eps Pr(>F[HF])
Dose 0.8834696  0.0461275
Same answers as SPSS, of course, which is good. Now, for long-format, which is actually both harder and easier, depending on your background.
Simple Main Effects in R, Long Format
So, assuming the data are in a frame called “stim.lng” as in the example above, the way I think of doing this is in a for() loop. Essentially, this is exactly the same as the between-subjects version of this, which is great if you’re already comfortable with the idea of a for() loop, which not all psychology students are. Be that as it may, here’s a very simple loop which not only gets the job done but makes nice labels:
for (Type in levels(stim.lng$TypeF)) {

cat("\n------ Drug Type:", Type, "-----\n")

print(ezANOVA(stim.lng[stim.lng$TypeF==Type,], dv=Alrtns, wid=Snum, within=.(DoseF), detailed=T))

}
And here’s the output:
------ Drug Type: T1 -----
$ANOVA
       Effect DFn DFd        SSn      SSd          F            p p<.05       ges
1 (Intercept)   1  15 23585.3333 144.6667 2445.48387 4.964361e-18     * 0.9824272
2       DoseF   2  30   386.7917 277.2083   20.92966 2.039732e-06     * 0.4783079

$`Mauchly's Test for Sphericity`
  Effect         W            p p<.05
2  DoseF 0.2897867 0.0001716125     *

$`Sphericity Corrections`
  Effect       GGe        p[GG] p[GG]<.05       HFe        p[HF] p[HF]<.05
2  DoseF 0.5847224 0.0001502653         * 0.6041376 0.0001227022         *


------ Drug Type: T2 -----
$ANOVA
       Effect DFn DFd        SSn      SSd         F            p p<.05       ges
1 (Intercept)   1  15 32396.0208 1360.312 357.22697 7.147465e-12     * 0.9507281
2       DoseF   2  30   384.0417  318.625  18.07964 7.046240e-06     * 0.1861588

$`Mauchly's Test for Sphericity`
  Effect         W         p p<.05
2  DoseF 0.9125831 0.5271171

$`Sphericity Corrections`
  Effect       GGe        p[GG] p[GG]<.05      HFe       p[HF] p[HF]<.05
2  DoseF 0.9196105 1.465652e-05         * 1.042018 7.04624e-06         *


------ Drug Type: T3 -----
$ANOVA
       Effect DFn DFd        SSn      SSd          F            p p<.05       ges
1 (Intercept)   1  15 24345.0208 321.3125 1136.51138 1.480283e-15     * 0.9621128
2       DoseF   2  30   153.2917 637.3750    3.60757 3.944790e-02     * 0.1378548

$`Mauchly's Test for Sphericity`
  Effect        W         p p<.05
2  DoseF 0.753376 0.1377471

$`Sphericity Corrections`
  Effect       GGe      p[GG] p[GG]<.05       HFe     p[HF] p[HF]<.05
2  DoseF 0.8021665 0.05145518           0.8834696 0.0461275         *
Note the identical F-values to the other two ways of doing this. However, this seems much easier to me than writing out three separate ones and scales better to larger designs. Of course, simple main effects aren’t my preferred way of dealing with this problem in the first place, and that’s where things start go get dicey.
Interaction Contrasts
Again, no, there’s not an interaction here. However, for pedagogical reasons, I’m going to go through interaction contrasts anyway, because this is where getting SPSS and R to produce the same answer is a little more complicated. Actually, with interaction contrasts, getting either package to produce an answer is not as straightforward as it might be, but both support it.
So what interaction contrast do we want? Since there isn’t really an interaction, it doesn’t matter much. Let’s say the experiment had come out differently, and not only was drug Type 2 better, but that interacted with Dose—let’s say the dose-response function was much steeper for drug Type 2. We’d want a linear contrast on dosage, which is (1 0 -1) on Dose, and we want to compare drug Type 2 with the average of the other two groups, which is (1 -2 1) on Dose. We want the outer product of those across the nine means—an interaction contrast. So, how do we make that happen in the two packages?
Interaction Contrasts in SPSS
In between-subjects ANOVA, SPSS’s support for interaction contrasts is utterly awful, as I mentioned in the blog post where I covered it. The good news is that it’s better for within-subjects ANOVA. It’s still not wonderful, but at least SPSS will do the cross-multiplication for you here (which it won’t for between-subjects ANOVA—don’t get me started). For a within-subjects ANOVA, we have to tell SPSS what contrasts we want, and if we only want one contrast on each, the easiest way to keep everything straight is to just repeat those contrasts in each of the statements. For the contrast we want, the syntax looks like this:
GLM T1D1 TO T3D3

/WSFACTOR Type 3 SPECIAL(1 1 1

1 -2 1

1 -2 1)

Dose 3 SPECIAL(1 1 1

1 0 -1

1 0 -1).
Kind of ugly. Note that repeated the contrasts twice isn’t necessary in the sense that if you wanted to put in other contrasts besides just the one I specified above, you could. You cannot, however, just put in the one you want and be done—SPSS requires that the matrix you specify on each factor be k by k, where k is the number of levels of the variable, and the first entry in the matrix must be all 1s. Why this is required is unclear. Anyway, here’s the relevant part of the output:

And, as expected, the test fails with a p-value of .455. Not a surprise since there isn’t really an interaction—but this is how you might break one down with contrasts.
Note that just as with one-way repeated-measure ANOVA, this assumes that each contrast gets its own error term, and thus we need not assume sphericity here, but we do lose some degrees of freedom in the error term. If this is a problem, then it’s possible to use the MSE from the original ANOVA and adjust the sum of squares for the contrast by dividing it by the squared vector length to produce an appropriate F. This is annoying to do, and it would be nice if SPSS gave the option to use the pooled error term for those who want it.
Interaction Contrasts in R, Wide Format
As noted in my previous post on one-way repeated measures ANOVA, R has good tactilities for vector (and matrix) multiplication, and that’s probably the easiest way to do contrasts in wide-format data: multiply the data by the contrast you want, and do a t-test on the resulting variable. The same strategy applies here, only now you need to take the outer product of the vectors on the two different independent variables and multiply your data matrix by the result of that. It sounds cumbersome but it’s really not that bad.
Remember that we have (1 0 -1) on Dose and (1 -2 1) on Type. We’ll take the outer product of those and just multiply by an array created by putting together all the relevant variables:
## build the contrast vector. Contrast on Dose goes first, because

## Dose changes fastest (opposite order of SPSS!)

LVec = c(c(1, 0, -1) %o% c(1, -2, 1))
## Multiply
L = cbind(T1D1, T1D2, T1D3, T2D1, T2D2, T2D3, T3D1, T3D2, T3D3) %*% LVec
## Do the test.
t.test(L)
And this is what you get:
One Sample t-test

data: L
t = 0.7663, df = 15, p-value = 0.4554
alternative hypothesis: true mean is not equal to 0
95 percent confidence interval:
-4.11939 8.74439
sample estimates:
mean of x
2.3125
Remember that SPSS produced F(1, 15) = 0.59, p = .455, so this does indeed produce the same result as SPSS, and rests on the same set of assumptions (no sphericity required, but no pooling of error d.f.).
Interaction Contrasts in R, Long Format
As far as I can tell, if you do it this way, you cannot get the same results out that you get from SPSS. There may well be some trick here that I don’t know, but so far I have been unable to get R to do this without using the pooled error term, and therefore requiring the assumption of sphericity. Whether that’s a good or a bad thing is not something I’m going to debate here, I just want to be up-front about what’s going on.
Furthermore, for reasons that I have not yet been able to determine, this method sometimes (frequently) completely fails, and R provides no information about why. I’ll admit that I’m a little flummoxed here and if there are any R folks out there who can help, I would most definitely appreciate the assistance.
The basic idea is to set up contrasts on the factors, run the ANOVA, and then ask for the summary to split the output according to those contrasts. The ezANOVA() procedure will kindly return the aov object in order to facilitate this, and then you can call summary() on that. It looks like this:
## set up the factors with the contrasts we want, and label them

contrasts(stim.lng$TypeF) = cbind(c(1, -2, 1))

contrasts(stim.lng$DoseF) = contr.poly(3)

TypeLb = list("2vs1&3"=1)

DoseLb = list("Linear"=1, "Quad"=2)
## run ANOVA with ez, but save out the result
ezANOVA(stim.lng, dv = Alrtns, wid = Snum, within = .(TypeF, DoseF), detailed=T)
AnvE = ezANOVA(stim.lng, dv = Alrtns, wid = Snum, within = .(TypeF, DoseF), return_aov=T)$aov
summary(AnvE, split=list(TypeF=TypeLb, DoseF=DoseLb))
This gives us results that actually match SPSS in terms of sums of squares for the main effect contrasts, but then, for no reason this is provided in the output, the interaction contrast simply do not appear at all:
Error: Snum
          Df Sum Sq Mean Sq F value Pr(>F)
Residuals 15  816.9   54.46

Error: Snum:TypeF
                Df Sum Sq Mean Sq F value  Pr(>F)
TypeF            2  425.9   213.0   6.329 0.00509 **
  TypeF: 2vs1&3  1  422.9   422.9  12.569 0.00131 **
Residuals       30 1009.4    33.6
---
Signif. codes:  0 ‘***’ 0.001 ‘**’ 0.01 ‘*’ 0.05 ‘.’ 0.1 ‘ ’ 1

Error: Snum:DoseF
                Df Sum Sq Mean Sq F value   Pr(>F)
DoseF            2  878.4   439.2  20.200 2.78e-06 ***
  DoseF: Linear  1  876.0   876.0  40.291 5.30e-07 ***
  DoseF: Quad    1    2.3     2.3   0.108    0.745
Residuals       30  652.3    21.7
---
Signif. codes:  0 ‘***’ 0.001 ‘**’ 0.01 ‘*’ 0.05 ‘.’ 0.1 ‘ ’ 1

Error: Snum:TypeF:DoseF
                             Df Sum Sq Mean Sq F value Pr(>F)
TypeF:DoseF                   4   45.7  11.434   1.181  0.328
  TypeF:DoseF: 2vs1&3.Linear  1
  TypeF:DoseF: 2vs1&3.Quad    1
Residuals                    60  580.9   9.682
Again, I’m not sure why, but this is another symptom of poor support for repeated measures in R. I’m positive that there is some way to get R to produce the relevant numbers—probably by computing all the relevant sums of squares manually—but I highly doubt your average first-year psychology graduate student is likely to be willing to go that route if the SPSS alternative is available.
Translating SPSS to R: One-way Repeated Measures
There’s just no two ways about this: R is just not all that well-configured for repeated measures. Most of the ways of handling repeated measures in R are cumbersome, and some of them just flat-out fail under certain conditions. It’s not a great situation.
Generally speaking, people in the R community do not appear much concerned about this. The argument is usually that mixed linear models is a better way to go because it doesn’t require the same set of restrictive assumptions that repeated measures ANOVA requires. This is fundamentally an argument about sphericity (or, more technically, compound symmetry). If there were no downsides whatsoever to linear mixed models, I’d be OK with this, but it turns out there are some drawbacks that I’ll talk about in some later blog post. Furthermore, repeated measures ANOVA is still far more common in experimental psychology circles, and that’s where I run, so I not only need to be able to do them, I need to be able to teach new graduate students how to do them and how to understand them. R seems designed to make this particularly difficult. In general, R is more difficult to teach with than SPSS, but here’s where it gets particularly ugly.
As usual, I’d like to start with SPSS. However, before I can get into that, I need to spend some time talking about data file formatting. Yes, nuts and bolts stuff gets in there right away. The data come from an experiment (probably fictional—I don’t actually remember where these data came from originally) in which kids were shown the same cartoon on three different days. For those of you who don’t (or didn’t) have small children, kids’ capacity to watch the same thing over and over again and still find it funny is one of the truly amazing feats of childhood. So, the study was done to see if kids would rate the same cartoon less funny after subsequent viewings. Eight kids saw the same cartoon for three consecutive days, and rated how funny it was each time.
So, first we run into the question of “how should the data file be structured?” For between-subjects data, pretty much everybody does it the same way: each line of the data file contains the data for each subject, respectively. This makes sense, since each subject only contributes one observation. But for within-subject data, this isn’t clear. Should it be one observation per line, or one subject per line? It turns out these two ways to do it even have names: one observation per line is called “long” format and one subject per line is called “wide” format.
Wide format looks like this (and is in the file cartoon.xls):
| Subj |
Day1 |
Day2 |
Day3 |
| 1 | 6 | 5 | 2 |
| 2 | 5 | 5 | 4 |
| 3 | 5 | 6 | 3 |
| 4 | 6 | 5 | 4 |
| 5 | 7 | 3 | 3 |
| 6 | 4 | 2 | 1 |
| 7 | 4 | 4 | 1 |
| 8 | 5 | 7 | 2 |
So, each line of data has the subject number, and then three observations per subject. Each variable (i.e., “Day2”) represents one measurement on each subject. Here’s what the “long” version of this looks like:
| Subj |
Trial |
Rating |
| 1 | Day1 | 6 |
| 2 | Day1 | 5 |
| 3 | Day1 | 5 |
| 4 | Day1 | 6 |
| 5 | Day1 | 7 |
| 6 | Day1 | 4 |
| 7 | Day1 | 4 |
| 8 | Day1 | 5 |
| 1 | Day2 | 5 |
| 2 | Day2 | 5 |
| 3 | Day2 | 6 |
| 4 | Day2 | 5 |
| 5 | Day2 | 3 |
| 6 | Day2 | 2 |
| 7 | Day2 | 4 |
| 8 | Day2 | 7 |
| 1 | Day3 | 2 |
| 2 | Day3 | 4 |
| 3 | Day3 | 3 |
| 4 | Day3 | 4 |
| 5 | Day3 | 3 |
| 6 | Day3 | 1 |
| 7 | Day3 | 1 |
| 8 | Day3 | 2 |
Here, there are 24 lines of data with a variable for subject number (which now has recurring values), a variable representing which day the measurement is, and the rating given.
So, what’s the big deal? Well, it turns out that SPSS (and numerous other stat packages) assume that repeated-measures data is represented in wide format. R can handle both, but there are some advantages to wide-format data even in R, and fortunately it’s pretty easy to go from wide to long in R.
So, the rest of this is going to be done assuming the data are in wide format, as in cartoon.xls.
Basic ANOVA in SPSS
SPSS makes this quite easy. The basic command for this is the GLM command (stands for “general linear model”) and it’s fairly straightforward:
GLM Day1 Day2 Day3

/WSFACTOR Trial 3.
The first line is the command name followed by the list of variables to be included, and the second line defined the repeated measures (or “WS” for “within subjects”) factor, gives that factor a name, and tells SPSS how many levels it has.
It produces rather a lot of output. I’m going to skip the “multivariate tests” output (because if you’re going there, then I’m fully with the “use mixed linear models” argument). The first relevant part of the output is the sphericity diagnostics:

I’m not a big fan of Mauchly’s test because it has low power when sample size is small, but SPSS also produces epsilon estimates so it’s OK. Next is the actual ANOVA table:

It would be nice if it had total SS on it so that it’s easier to compute effect sizes (you can ask SPSS to provide partial eta squared, but that’s not really my preferred measure). Nonetheless, it has pretty much all the other stuff you’d want. There is another piece of output that is provided by default by SPSS, which is contrast output. SPSS assumes, rightly or wrongly, that if you don’t specify what contrasts you want, that you want polynomial contrasts on all your independent variables. Thus, you get this whether you want it or not:
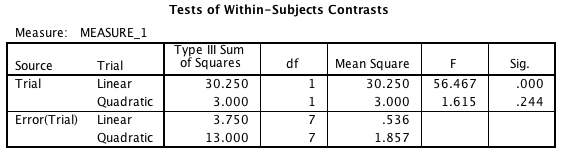
Notice that the error term has only 7 degrees of freedom, and that each contrast has its own error term. This is a particular choice on the part of the SPSS developers. What this means is that the error terms are unique and thus do not require the sphericity assumption. It also means that these tests exactly match what you get if you do your repeated measures contrasts by t-test (more on that in a bit).
Some people prefer pooling the error term, that is, using the error term from the original RM ANOVA (the one with 14 df), but that requires the sphericity assumption, and the test doesn’t match the contrast t-test. This is the kind of thing reasonable people can disagree about (again, I’m not in the business of telling people how to adjudicate arguments like that on this blog—for now). It would be nice if SPSS gave the option to include the tests computed that way. Note that technically you can compute it yourself by hand if you want to, but you have to make sure you normalize the contrast vectors to make this work.
Basic ANOVA in R, Wide Format
R is not in the business of making this easy. Essentially, the way you do this in R is to set up a linear model with the “lm()” function, and then tell SPSS that’s it’s really a repeated measures ANOVA using the “Anova()” command out of the “car” package. It’s a little more laborious, but for a one-way it’s not really that bad. Again, assuming the data has been read in and attached, the code looks something like this (with annotations in the code this time):
## load “car” to get the Anova() function

library(car)
## Create a model of the within-subjects factors
Anv1 = lm(cbind(Day1, Day2, Day3)~1)
## Create a labeled factor for w-s factors
Trial = factor(c("Day1", "Day2", "Day3"))
## do the ANOVA. “idata” and “idesign” tell Anova() how to
## structure within-subjects factors
Anv2 = Anova(Anv1, idata=data.frame(Trial), idesign=~Trial)
## Get out the ANOVA tables and adjustments
summary(Anv2, multivariate=F)
Somewhat more than SPSS indeed. Here’s the output:
Univariate Type III Repeated-Measures ANOVA Assuming Sphericity

                SS num Df Error SS den Df       F    Pr(>F)
(Intercept) 408.37      1   18.625      7 153.483 5.132e-06 ***
Trial        33.25      2   16.750     14  13.896 0.0004735 ***
---
Signif. codes:  0 ‘***’ 0.001 ‘**’ 0.01 ‘*’ 0.05 ‘.’ 0.1 ‘ ’ 1


Mauchly Tests for Sphericity

      Test statistic p-value
Trial        0.66533 0.29452


Greenhouse-Geisser and Huynh-Feldt Corrections
 for Departure from Sphericity

       GG eps Pr(>F[GG])
Trial 0.74925   0.001856 **
---
Signif. codes:  0 ‘***’ 0.001 ‘**’ 0.01 ‘*’ 0.05 ‘.’ 0.1 ‘ ’ 1

         HF eps   Pr(>F[HF])
Trial 0.9077505 0.0007808673
Unlike SPSS, no contrasts are provided by default, but all the relevant output matches. Unlike with SPSS, R doesn’t compute what the adjusted degrees of freedom are, so you have to compute those by hand. Not hard, but slightly annoying—isn’t computing stuff kind of the point of doing it in software in the first place? But I digress.
So, the basic ANOVA is not too bad to do in R with wide-format data. Let’s take a look at contrasts in both packages.
Custom Contrasts in SPSS
There are two relatively straightforward ways to do custom contrasts in SPSS: as t-tests and as part of the GLM. First, the contrasts. By default it provides polynomials so let’s do something else. Let’s try two: (-2 1 1) to compare the first viewing with the mean of the later viewings (that is, is it only funny once?), and then (0 1 -1) to compare the second and third viewings. To do those as t-test in SPSS, we just compute the relevant variables and test whether or not those equal zero:
COMPUTE Day1vs23 = -2*Day1 + Day2 + Day3.

COMPUTE Day2vs3 = Day2 - Day3.

EXECUTE.
T-TEST
/VAR Day1vs23 Day2vs3 /TESTVAL 0.
Why on earth SPSS requires the EXECUTE statement is beyond me, but I’ve complained about that before so I’ll leave it alone for now. Here’s the output:

Apparently, even for the kids, the cartoon is getting less funny over repeated viewings; even the second and third viewing are different. Anyway, that gets the job done. It is also possible, however, to do the contrasts right within the GLM itself. To do that, you need to tell SPSS to run contrasts in the WSFACTOR subcommand. It looks like this:
GLM Day1 TO Day3

 /WSFACTOR Trial 3 SPECIAL(1  1  1

                          -2  1  1

                           0  1 -1).
You see the “-2 1 1” vector and the “0 1 -1” vectors there in the command. Why the “1 1 1” vector is required is a mystery to me, since you’re not allowed to put anything else in there. Bizarre. Anyway, the first part of the output is the same as the previous GLM command, but the contrast output is different:
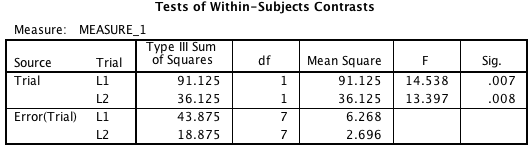
Note the p-values are the same as the previous output, and those Fs are the square of the ts from the previous output. SPSS will also supply the partial eta squared values for the contrasts if you ask it to with at “/PRINT ETASQ” command. Again, not my preferred measure of effect size.
Custom Contrasts in R, Wide Format
The “Anova()” procedure in R doesn’t support contrasts at all, so you more or less have to do it by t-test. The good news is that R understands matrix multiplication, so you can at least make the code short. First, the SPSS way, writing out the contrast coefficients implicitly:
Day1vs23 = -2*Day1 + Day2 + Day3

t.test(Day1vs23)

Day2vs3 = Day2 - Day3

t.test(Day2vs3)
There is a slightly quicker way to do this that relies on R’s ability to do matrix multiplication. I prefer this because it lets you write out the contrast vectors explicitly:
Day1vs23 = cbind(Day1, Day2, Day3) %*% c(-2, 1, 1)

t.test(Day1vs23)

Day2vs3 = cbind(Day1, Day2, Day3) %*% c(0, 1, -1)

t.test(Day1vs23)
And here are the results (they’re identical for both code snippets above):
One Sample t-test

data: Day1vs23
t = -3.8129, df = 7, p-value = 0.006603
alternative hypothesis: true mean is not equal to 0
95 percent confidence interval:
-5.468036 -1.281964
sample estimates:
mean of x
-3.375

One Sample t-test

data: Day2vs3
t = 3.6602, df = 7, p-value = 0.008068
alternative hypothesis: true mean is not equal to 0
95 percent confidence interval:
0.7521863 3.4978137
sample estimates:
mean of x
2.125
So, as it should, R agrees with SPSS on these tests. All is well in the universe, right? Well, maybe, unless (a) you have long-format data, or (b) you’d like to use pooled error terms in your contrast tests. In the case of (b), those tests will not necessarily agree with SPSS, though of course SPSS will let you compute those tests if you really want them, as all the appropriate information is on the printout. So, let’s take a look at R with long-format data.
Conversion to Long Format in R
The good news is that if you want long-format data in R and you have wide-format data, it’s pretty easy to transform the data. (This is also possible in SPSS, but it’s moderately cumbersome to do it and I have to look it up every time.) Let’s say the data is in a data frame called “cartoon.” I’m going to put it into long format with a command called “melt()” from the “reshape2” library. The commands look like this:
detach(cartoon)

library(reshape2)

cartoon.lng = melt(cartoon, id.vars="Subj", variable.name="Trial", value.name="Rating")
Note that the “detach()” isn’t technically necessary. This produces a data frame called “cartoon.lng” that looks exactly like the long-format table earlier in the post.
Basic ANOVA in R, Long Format
R offers multiple ways to handle the ANOVA in wide format. The simplest way is to use the “ezANOVA()” function out of the “ez” package. Essentially this is really just a wrapper for the “car::Anova()” function we used last time, but it makes things slightly easier, particularly for more complex designs. For this one-way design, the simplicity gain isn’t that large. The code looks like this:
library(ez)

cartoon.lng$SubjF = factor(cartoon.lng$Subj)

ezANOVA(cartoon.lng, dv = Rating, wid = SubjF, within = Trial, detailed=T)
So, that code loads the “ez” library, creates a new variable in the “cartoon.lng” data frame that is the “Subj” variable represented as a factor, then does the ANOVA with “Rating” as the dependent variable (hence “dv”), notes that the variable that identifies subject (the “wid”) is the variable “SubjF” and the within-subjects variable (“within”) is “Trial”. Here’s the output:
$ANOVA
       Effect DFn DFd     SSn    SSd         F            p p<.05       ges
1 (Intercept)   1   7 408.375 18.625 153.48322 5.131880e-06     * 0.9202817
2       Trial   2  14  33.250 16.750  13.89552 4.734931e-04     * 0.4845173

$`Mauchly's Test for Sphericity`
  Effect         W         p p<.05
2  Trial 0.6653301 0.2945177

$`Sphericity Corrections`
  Effect       GGe      p[GG] p[GG]<.05       HFe        p[HF] p[HF]<.05
2  Trial 0.7492489 0.00185552         * 0.9077505 0.0007808673         *
And of course the output matches the wide-format use of “car::Anova()” since it’s actually using that procedure to do the actual ANOVA. Note that this automatically provides an estimate of effect size; that’s the “ges” on the printout. This is the “generalized eta squared” measure from Bakeman (2005), which is not really a standard in Psychology but is a defensible choice and is certainly not unheard-of.
The minor down side to ezANOVA is that it doesn’t let you do contrasts. Well, actually, you can, but to do so you need to have ezANOVA return the lm object, which it will do, but to understand how to use that you need to do what’s in the next section anyway, so I’ll go through that.
Custom Contrasts in R, Wide Format
This is where I dislike doing things in the long format in R, because the only straightforward way to do the contrasts provides you with what you have to do by hand in SPSS, that is, pooled error terms.
First, it is actually possible to do the ANOVA with long-format data without using “ezANOVA().” However, if you do it this way, you do not get sphericity diagnostics, which seems like a really bad idea to me. (Look, I get that the logic is that mixed linear models don’t make this assumption, but how do you know how important that assumption is if you don’t get information about it? Seems backward to me.) Anyway, you do this in R by specifying the within-subjects error term in the specification of the model. It looks like this:
Anv = aov(Rating ~ Trial + Error(SubjF/Trial), data=cartoon.lng)

summary(Anv)
That whole “Error(SubjF/Trial)” is the specification of the within-subjects error term. Here’s the output:
Error: SubjF
          Df Sum Sq Mean Sq F value Pr(>F)
Residuals  7  18.62   2.661

Error: SubjF:Trial
          Df Sum Sq Mean Sq F value   Pr(>F)
Trial      2  33.25  16.625    13.9 0.000473 ***
Residuals 14  16.75   1.196
---
Signif. codes:  0 ‘***’ 0.001 ‘**’ 0.01 ‘*’ 0.05 ‘.’ 0.1 ‘ ’ 1
How can you not love that? The p-value to six decimal places, but the F-value to only two. Really? (Question for anyone who happens to read this from the R community: are there journals out there that request six decimal places for the p-value? If so, how many decimal places do they want for the F? Because in psychology the convention is for two decimal places in the F-value and no more than 3 for the p-value.) And while the relevant stuff matches the other SPSS and R outputs, as I noted, there’s no Mauchly test or sphericity epsilons there.
So that’s not great, but what about contrasts? Well, you do it pretty much how you do contrasts in between-subjects ANOVA in R: you set up the contrast, run the ANOVA, and you ask R to split up the output in the summary. It looks like this:
contrasts(cartoon.lng$Trial) = cbind(c(-2, 1, 1), c(0, 1, -1))

Anv = aov(Rating ~ Trial + Error(SubjF/Trial), data=cartoon.lng)

summary(Anv, split=list(Trial=list("Day1vs23"=1, "Day2vs3"=2)))
I know, pretty, isn’t it? Here’s the output:
Error: SubjF
          Df Sum Sq Mean Sq F value Pr(>F)
Residuals  7  18.62   2.661

Error: SubjF:Trial
                  Df Sum Sq Mean Sq F value   Pr(>F)
Trial              2  33.25  16.625   13.90 0.000473 ***
  Trial: Day1vs23  1  15.19  15.188   12.69 0.003120 **
  Trial: Day2vs3   1  18.06  18.062   15.10 0.001648 **
Residuals         14  16.75   1.196
---
Signif. codes:  0 ‘***’ 0.001 ‘**’ 0.01 ‘*’ 0.05 ‘.’ 0.1 ‘ ’ 1
So, there, contrasts in long-format repeated-measures ANOVA. You’ll note that these results do not agree with the results generated by SPSS or by the t-tests we did on the wide-format data. As I mentioned before, these use the pooled error term, which means you have to be especially careful with sphericity here.
Note that you can get the same results from SPSS with a little hand computation. If you go back to the “L1” line in the SPSS output when we did this contrast, note that the SS for the contrast was 91.125. The squared length of the (-2 1 1) vector is six, so if we take that SS and divide by six, we get 15.188, which is the SS for the contrast in the wide format for R, so we could compute the same 12.69 F-value by dividing by the (pooled) MSE of 1.196. So this method is available to SPSS users, though it’s kind of a hassle since you have to do a lot of the computations by hand.
Frankly, I’m not a fan of doing contrasts this way, which means if I’m using R, I pretty much have to stick to wide-format data. That’s basically OK in this context, but it can get a little cumbersome for ANOVAs with many within-subjects factors. That’ll be the subject for the next post…
